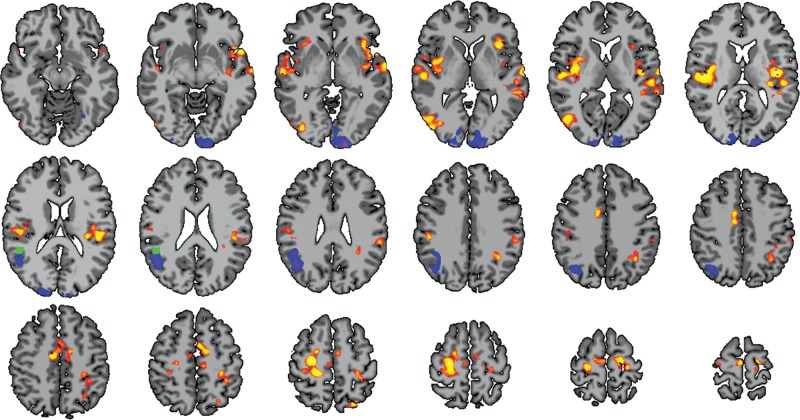
Figure 5.
Follow-up ROI connectivity analysis. Using the region of group difference detected by ch-ICD (green cube; see also Fig. 2A), very preterm participants showed several regions of significant connectivity when compared with term subjects (P < 0.05 corrected). Striking decreases in connectivity are observed in immediately surrounding structures to the ROI. Additionally, bilateral increases were seen in the frontal and temporal lobes.

