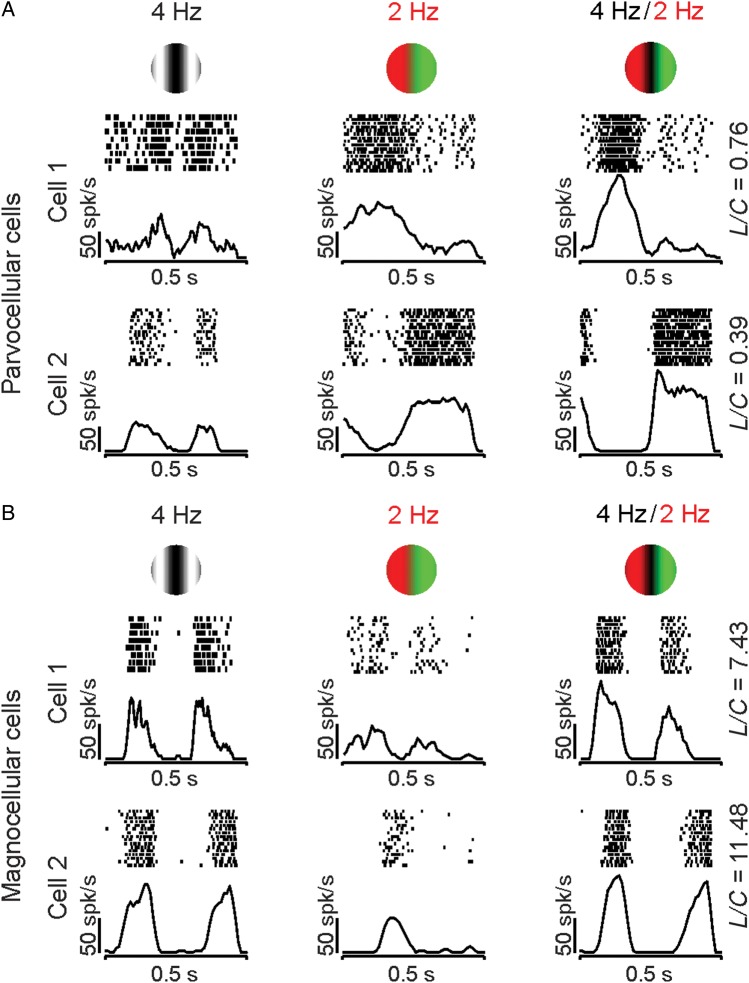
Figure 2.
Examples of visual responses from parvocellular and magnocellular retinal ganglion cells to color contrast. Parvocellular cells responded to the chromatic component of the compound grating, and magnocellular cells responded to the luminance component. (A) Examples of visual responses from 2 parvocellular cells to the 3 gratings. Note that the responses to the compound grating (right) resembled more closely those to the chromatic equiluminant grating (middle) than those to the luminance grating (left). Consequently, the ratio of luminance (L) and chromatic (C) responses, L/C, was <1 (shown on the right). (B) Examples of visual responses from 2 magnocellular cells to the 3 gratings. The responses to the compound grating (right) resembled more closely those to the luminance grating (left) than the chromatic grating (middle). Consequently, the ratio of the responses at the luminance (L) and chromatic contrasts (C) of the compound grating, L/C, was >1 (shown on the right). In these and the following figures, rasters and PSTHs were arbitrarily centered at each response cycle for illustration purposes.

