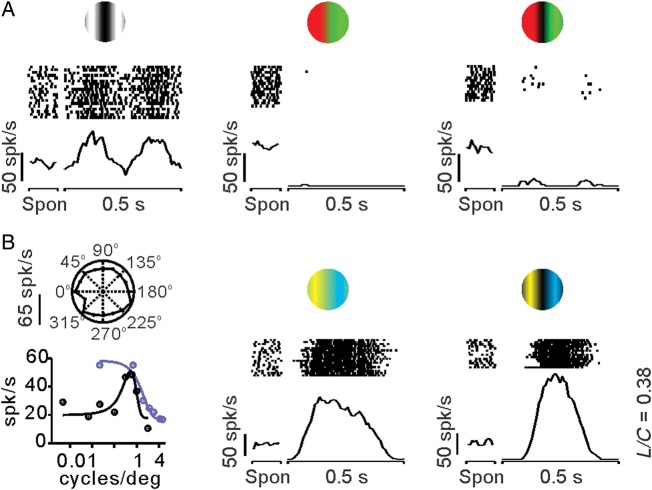
Figure 4.
Example of a Konio-like V1 cell that responded to blue–yellow color contrast. This V1 cell responded similarly to a retinal ganglion cell from the koniocellular pathway (Lee et al. 2011). The Konio-like V1 cell had high spontaneous activity (∼50 spk/s), responded weakly to luminance gratings, was completely turned off by red–green color gratings, and showed no OS. (A) Visual responses to luminance (left), equiluminant red–green color (middle), and red–green compound gratings (right). Note the high spontaneous activity (Spon) of the cell, which increases to >50 spk/s when using red–green color gratings. (B) The cell had no OS (left, top), and it showed band-pass spatial frequency tuning for luminance gratings (left, bottom, dark circles, and lines) and low-pass spatial frequency tuning for yellow–blue equiluminant gratings (left, bottom, blue circles, and lines). The strongest cell responses were obtained with an equiluminant (middle) and compound (right) yellow–blue color grating. The firing rate was measured as the first Fourier harmonic of the response to the drifting grating (F1) to plot orientation tuning and spatial frequency (left). The firing rate was measured as the instantaneous rate (spikes in a 10-ms bin) to plot the histograms (middle and right).

