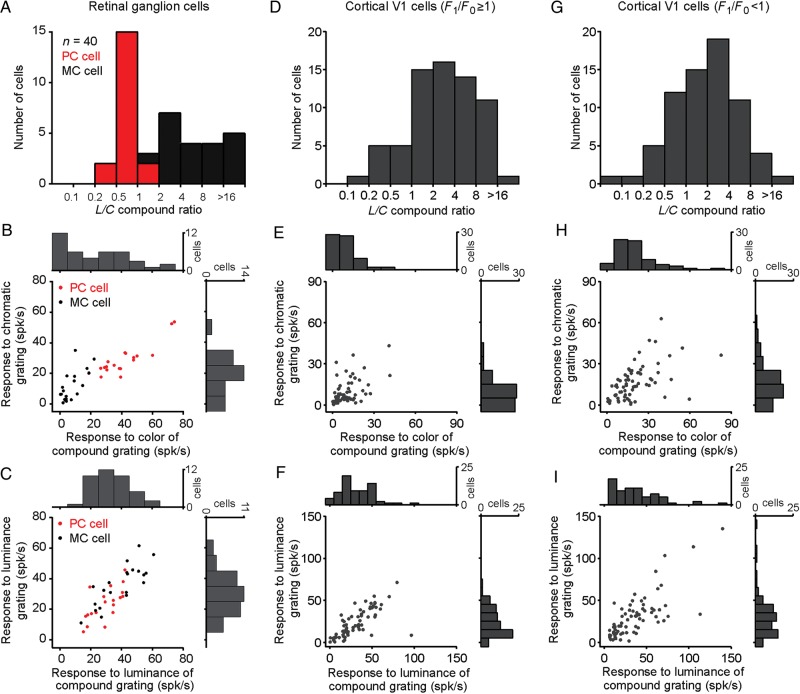
Figure 5.
Distribution of responses to color/luminance from retinal ganglion cells and V1 cells. In the retina, magnocellular and parvocellular cells responded strongly either to the luminance (L) or chromatic (C) contrast of the compound gratings. In contrast, in the visual cortex, the L/C distribution was unimodal. (A) Distribution of L/C ratios in retinal ganglion cells. (B) Scatter plots and histograms of the color responses from retinal ganglion cells to compound (x-axis) and equiluminant gratings (y-axis). (C) Scatter plots and histograms of the luminance responses from retinal ganglion cells to compound (x-axis) and luminance gratings (y-axis). (D–F) Same as A–C for V1 cells with linear spatial summation (F1/F0 ≥ 1). (G–I) Same as A–C for V1 cells with nonlinear spatial summation (F1/F0 < 1).

