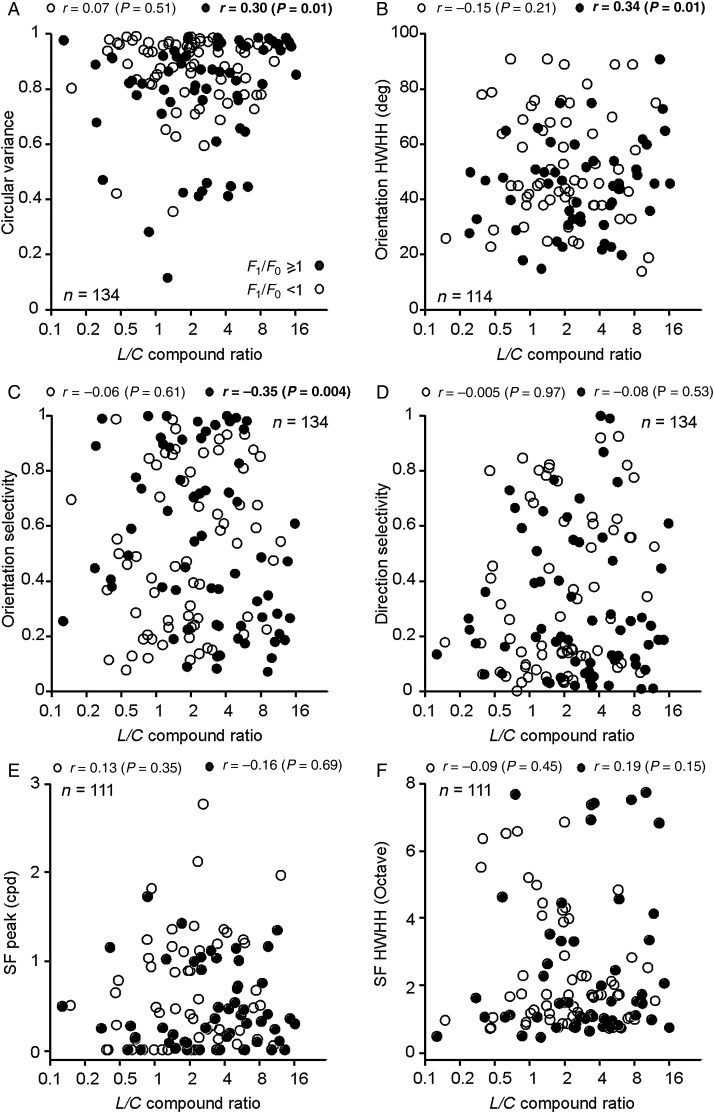
Figure 6.
Relation between luminance/color preference and stimulus selectivity in linear and nonlinear V1 cells. Scatter plots showing how luminance/color preference (L/C ratio) relates to different response properties of linear (F1/F0 ≥ 1, solid circles) and nonlinear cells (F1/F0 < 1, open circles). Correlation (r) and significance (P) values are shown at the top of each plot. Significant correlations are highlighted in bold. (A)Significant correlation between L/C and CV in linear cells (r = 0.3, P = 0.01). (B)Significant correlation between L/C and orientation HWHH in linear cells (r = 0.34, P = 0.01). (C) Significant correlation between L/C and OS in linear cells (r = −0.35, P < 0.01). (D) No significant correlations between L/C and DS. (E) No significant correlations between L/C and the spatial frequency peak. (F) No significant correlations between L/C and spatial frequency HWHH.

