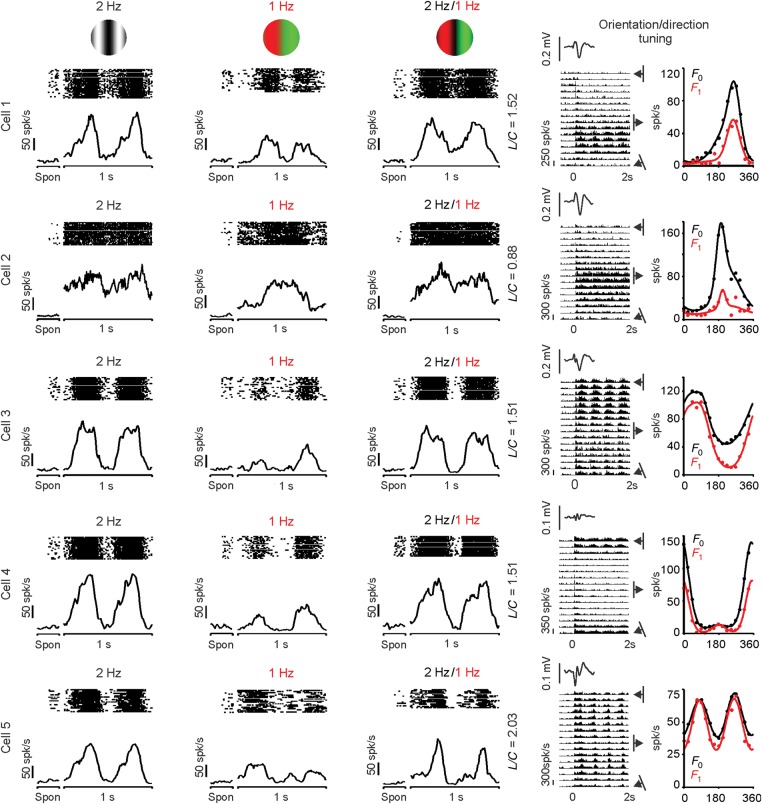
Figure 7.
Examples of nonlinear V1 cells that were orientation/direction selective and responded to chromatic contrast. The histograms and rasters on the left illustrate responses to luminance (left), equiluminant red–green (middle), and compound (right) gratings. Spon: spontaneous activity. L/C: luminance/color ratio. The histograms and plots on the right illustrate the responses at different orientation preferences (histograms on the left) and the orientation/direction tuning (right plots). The orientation/direction tuning was measured as the mean firing rate (F0 in black) and as the F1 response (F1, red). The firing rate of the histograms was measured as the instantaneous rate (spikes in a 10-ms bin). The insets on the right at the top of the histograms show the average LFP, which was used to estimate the cortical depth of the recordings (see Materials and Methods).

