
Figure 1.
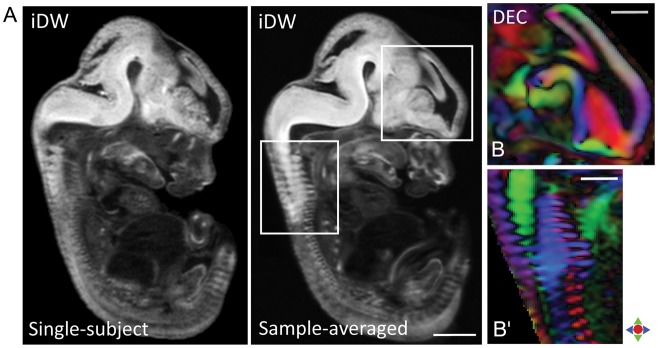
Representative sagittal sections from the E12.5 mouse embryo showing sample-averaged tensor contrasts in the embryonic brain. (A) Sagittal view shows iDW contrasts from single-subject (left) and sample-averaged (right) whole embryo images. (B–B′) Zoomed-in views of DEC images through select regions (in the forebrain and vertebral column, indicated by white boxes in A) illustrate the anatomical contrast and preservation of fine structural detail in the tensor-averaged orientation maps. Red: Medial-lateral; green: dorsal-ventral; blue: anterior-posterior. Scale bar for A = 1 mm, and for B–B′ = 0.5 mm.