Figure 2.
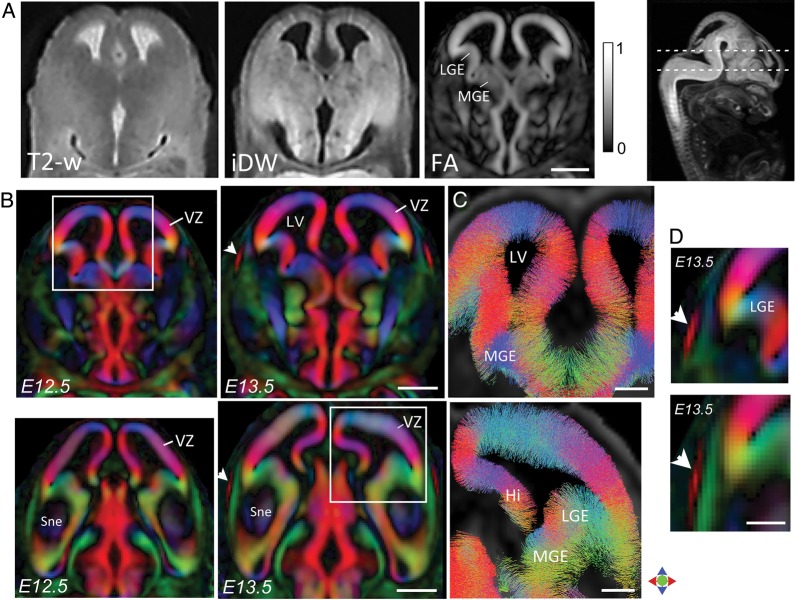
Diffusion MR microimaging of the embryonic mouse cortex at E12.5–E13.5. (A) Comparison of T2-weighted, iDW, and FA contrasts in a horizontal section through the E12.5 telencephalon shows markedly high diffusion anisotropy in the VZ (FA map, scale of 0–1). (B) DEC contrasts reveal the radial orientation of anisotropy throughout the VZ at E12.5 and E13.5. The location of the sections is indicated in the sagittal iDW image at the top right. White arrowheads indicate the appearance of the CP resolved in DEC maps at E13.5. Magnified views through the lateral cerebral wall are shown in D, indicating the emerging CP delineated by its radially oriented anisotropy (arrowheads). (C) Probabilistic streamline tracking based on the dMRI data (regions indicated by white boxes in B) shows fine radially oriented processes spanning the entire width of the VZ at E12.5 (top) and E13.5 (bottom). Fibers displayed in C are cropped to a horizontal slab of 0.1 mm thickness. Color indicates the local orientation (red: medial-lateral; green: dorsal-ventral; blue: anterior-posterior). Hi: hippocampal neuroepithelium; MGE: medial ganglionic eminence; LGE: lateral ganglionic eminence; LV: lateral ventricle; Sne: striatal neuroepithelium; VZ: ventricular zone. Scale bars for A–B = 0.5 mm and for C–D = 200 μm.

