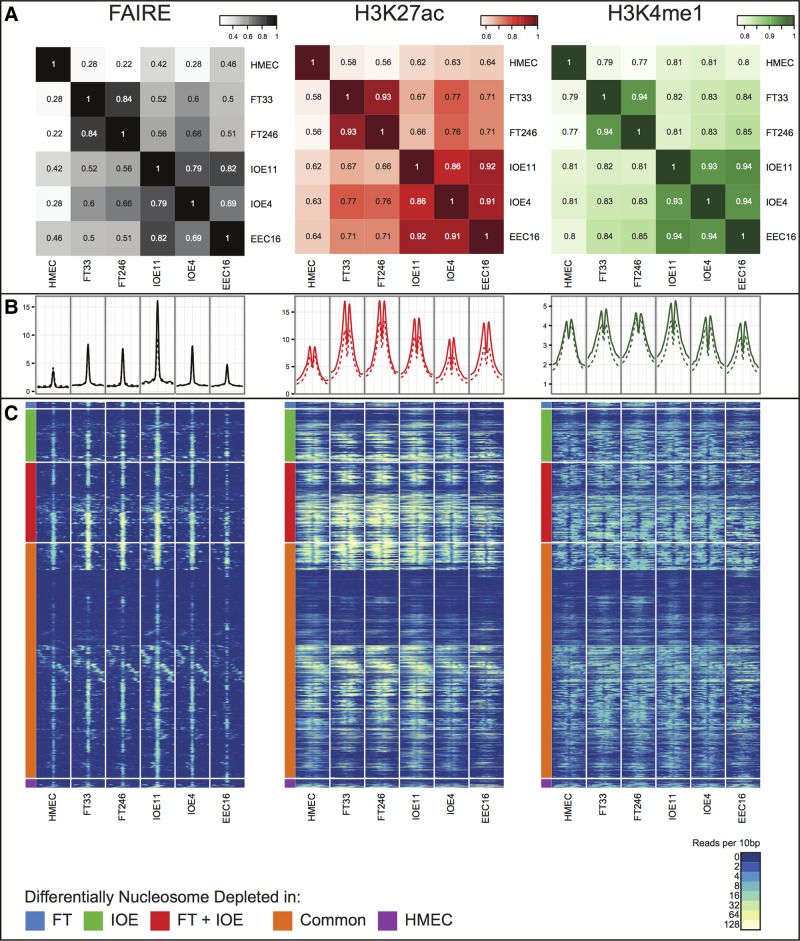
Figure 1.
(A) A global similarity matrix displaying the correlation (R2 values) of affinity scores between cell types for FAIRE, H3K27ac and H3K4me1 regulatory marks across the entire genome. The affinity scores are calculated from the values of the read counts across all samples with the set of common peaks (those that occurred in at least two samples) and then TMM marks normalized (using edgeR), using ChIP/FAIRE read counts minus Control read counts and Full Library size. (B) Enrichment profiles of FAIRE, H3K27ac and H3K4me1 normalized signal around the center of 4929 FAIRE peaks within the fine-mapped regions (solid lines) and 634 976 FAIRE peaks genome-wide (dashed lines). (C) Heatmap representing FAIRE, H3K27ac and H3K4me1 normalized signal in a ±1 kb window around the center of all nucleosome depleted regions as defined in Figure 1B. Normalized signal intensity represents read density within 10 bp windows. Hierarchical clustering was performed, supervised on differentially nucleosome depleted regions.

