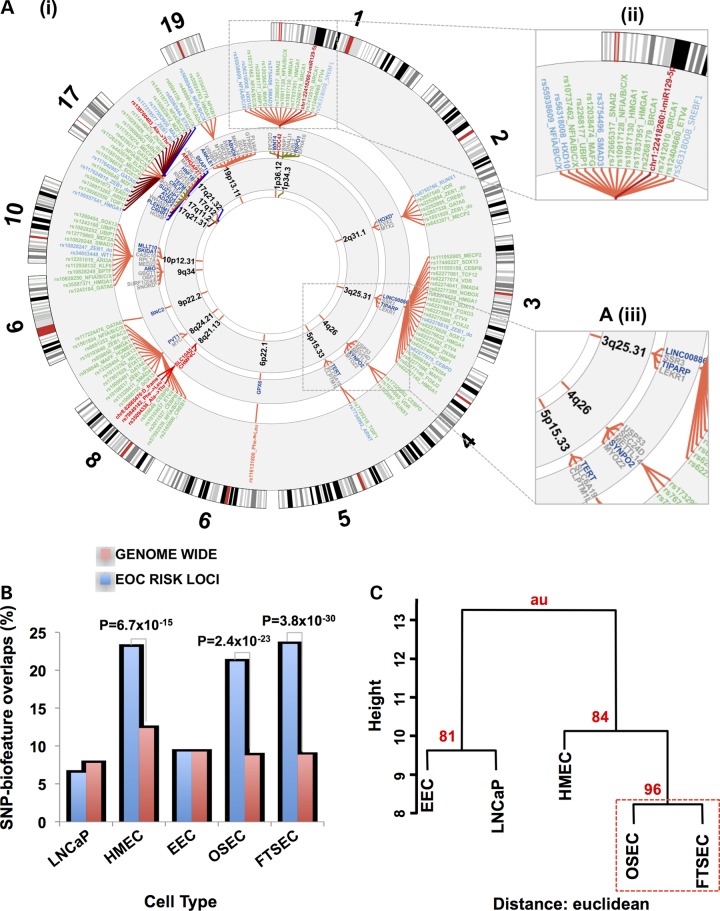
Figure 2. (.
A) (i) The ovarian cancer ‘riskome’ is displayed as a circular representation of the genome, excluding chromosomes that lack ovarian cancer risk regions. Concentric circles show, progressively from the inside-out, the chromosome band of the susceptibility region. The fine mapped SNPs (and inset A iii) in each region color-classified according to their putative functionality. Promotors are colored blue, putative enhancers green, coding variants red and miR targets burgundy. PWM motif-disruptions are included in the label with the SNP rsname (see Supplementary Material, Table S3 for full description). For some loci (e.g. chromosome 17) linking spanners have been assigned alternate colors to make the SNPs distinguishable when they are crowded. For physical disruptions (coding and miR target sequence) the gene name and spanners are also highlighted with the color corresponding to function. Genes (and inset A iii) within 100 kb of the top ranked risk SNP with the nearest gene in dark blue. (B) Analysis of SNP-regulatory biofeature intersections in gynecological tissues stratified by cell type, a human mammary epithelial cell (HMEC) line and the LNCaP prostate cancer cell line. The proportion of risk-SNPs intersecting regulatory biofeatures in the 17 ovarian cancer susceptibility regions was compared with the genome-wide distribution of SNPs intersecting regulatory biofeatures in the same tissues. (C) Bootstrap hierarchical cluster analysis for different cell types conditioned on the SNP-regulatory biofeatures interactions at the 17 confirmed HGSOC susceptibility regions.

