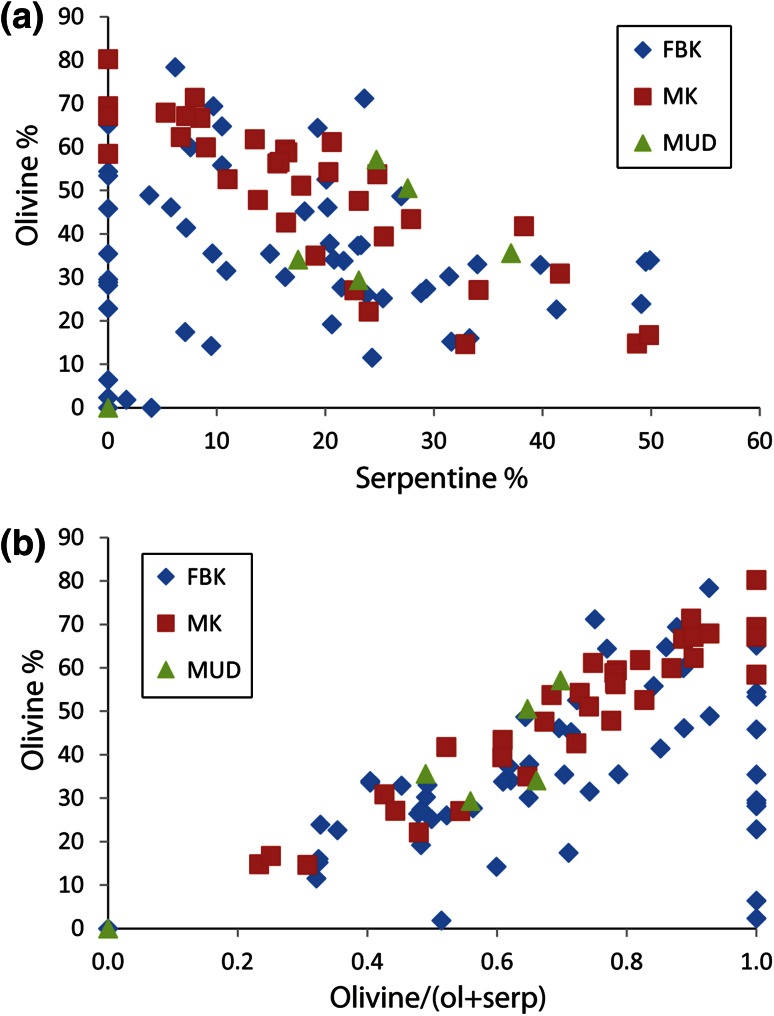
Fig. 10.
Graphs showing the results of XRD analysis of samples from the three lithologies at the A418 pipe. a Plot of olivine abundance against serpentine abundance, b plot of total abundance of fresh olivine against the fraction of fresh olivine in the olivine + serpentine component of the rock (a measure of how altered the rock is 1 being fresh and 0 being totally altered), and based on our modelling results, we can translate degree of alteration into a measure of original porosity (φ) with complete alteration occurring when the original porosity exceeded 40 %

