Fig. 2.

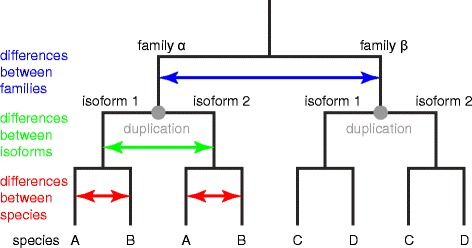
A scheme of the psbO phyllogeny showing three classes of PsbO sequence variability. Differences between families are in blue, differences between isoforms in green and differences between species in red

A scheme of the psbO phyllogeny showing three classes of PsbO sequence variability. Differences between families are in blue, differences between isoforms in green and differences between species in red