
Fig. 2.
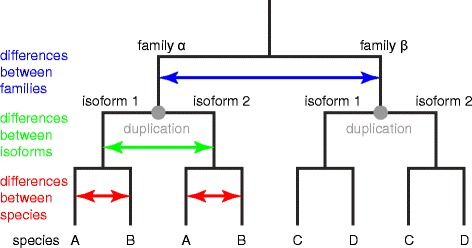
A scheme of the psbO phyllogeny showing three classes of PsbO sequence variability. Differences between families are in blue, differences between isoforms in green and differences between species in red
Official websites use .gov
A
.gov website belongs to an official
government organization in the United States.
Secure .gov websites use HTTPS
A lock (
) or https:// means you've safely
connected to the .gov website. Share sensitive
information only on official, secure websites.
A scheme of the psbO phyllogeny showing three classes of PsbO sequence variability. Differences between families are in blue, differences between isoforms in green and differences between species in red