Figure 2.

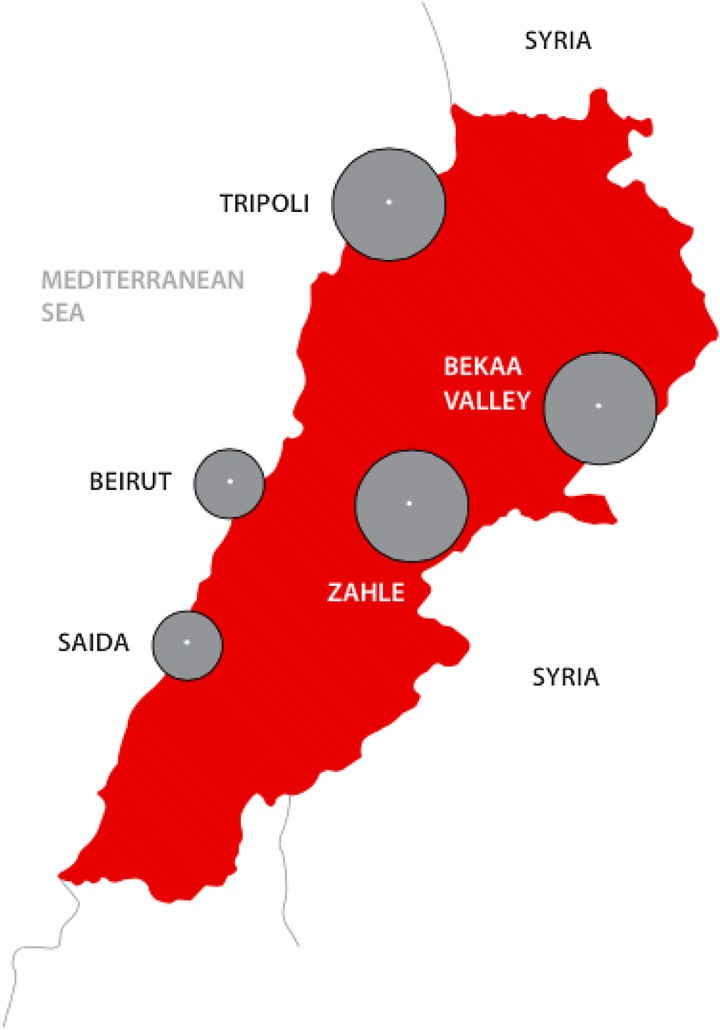
Geographic distribution of survey respondents. Size of circle is proportional to the number of elderly refugees sampled.

Geographic distribution of survey respondents. Size of circle is proportional to the number of elderly refugees sampled.