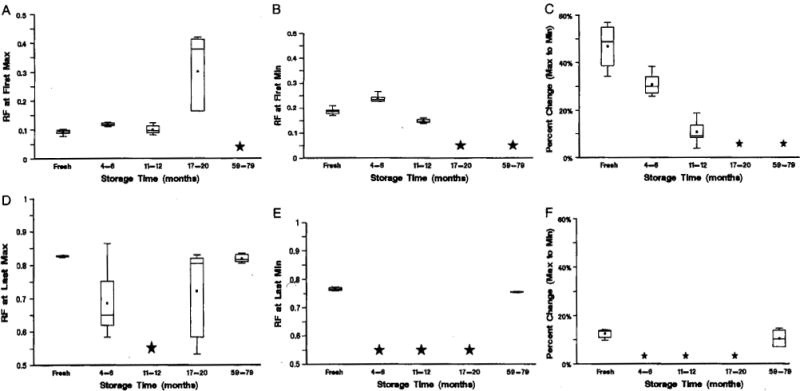
FIGURE 3.

Criteria established using fresh euploid samples as a function of storage time. A, Location of First Max; B, location of First Min; C, percent change from First Max to First Min; D, location of Last Max; E, location of Last Min, and F, percent change from Last Min to Last Max. A star indicates that there was no peak for more than half of the samples.
