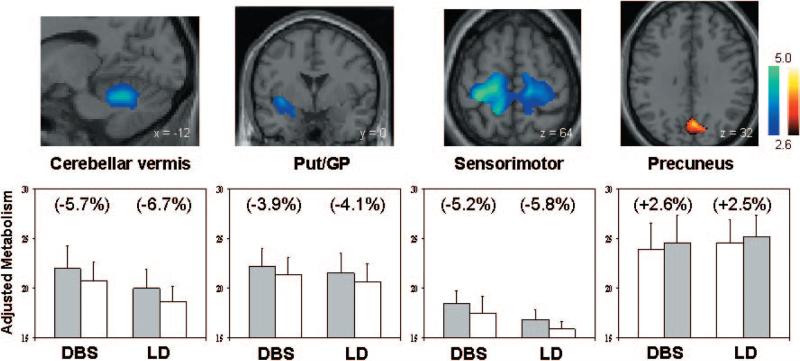
Fig. 2.
(Top) Regions in which the metabolic effects of treatment were similar for STN DBS and levodopa infusion (see text). Both interventions were associated with metabolic reductions in the cerebellar vermis, putamen/globus pallidus (Put/GP) and sensorimotor cortex (left and middle). Shared metabolic increases with treatment were identified in the precuneus (right). [SPM {t} maps were superimposed on a single-subject MRI brain template. Treatment-mediated metabolic decreases (blue–green scale) and increases (yellow–red scale) were thresholded at t = 2.6, P = 0.01 within the hypothesis-testing mask]. (Bottom) Bar graphs illustrating rates of glucose utilization for each of the significant clusters displayed above. Metabolic values (mean ± SE) are presented for each treatment condition. [OFF (filled bars) and ON (open bars) correspond to the treatment conditions for the stimulation (DBS) and levodopa (LD) groups. Regional changes with intervention appear in parentheses.]

