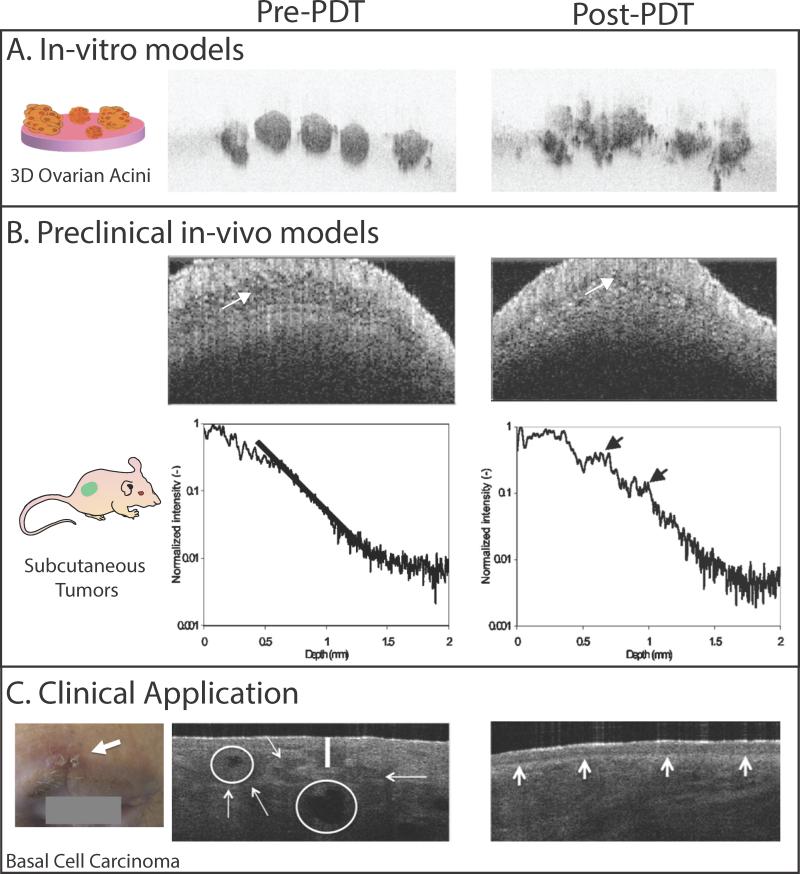
Figure 2.
Utility of OCT for visualizing PDT-induced structural changes in in-vitro 3D tumor nodules, preclinical animal models and human basal cell carcinoma in the clinic is shown here. A. Cross-sectional OCT image of 3D ovarian cancer acini are shown for time points before and 48 hours post PDT. Prior to PDT, the acini appear as small, solid and spherical structures. Due to PDT, a large-scale structural deformation in the acini can be observed.17 The images measure 1.16 mm × 770 μm B. The OCT image (top row) and backscattering intensity profiles (bottom row) from a subcutaneous tumor before treatment and ~2 h after PDT are shown here. In the pre- PDT image, the tumor has low backscattering intensity (white arrow). In the post-PDT image, the backscattering intensity increased due to PDT-induced tumor edema (white arrow) response in the tumor. The backscattering intensity profiles also show increased signal strength post-PDT (black arrows). Though differences between the pre and post-PDT tumor can be discerned in these images, it should be noted that increased signal levels at the surface could cause a decrease in the imaging penetration depth.18 C. A clinical photograph of a superficial basal cell carcinoma located above the eyebrow (white arrow). The OCT image (3.5 mm × 2 mm) of the lesions shows the disruption of normal layering (white vertical line) and tumor location and size (white arrows). The tumors have a reflective core due to central necrosis (white circles). PDT was performed on this subject using methyl aminolevulinate as a pro-drug. OCT image at a 3-month follow-up post-PDT shows complete remission with a fully restore dermoepidermal junction in this subject. The images in panels A, B and C are adapted from Evans et al,17 Aalders et al (2006)18 and Themstrup et al (2014)19 respectively.

