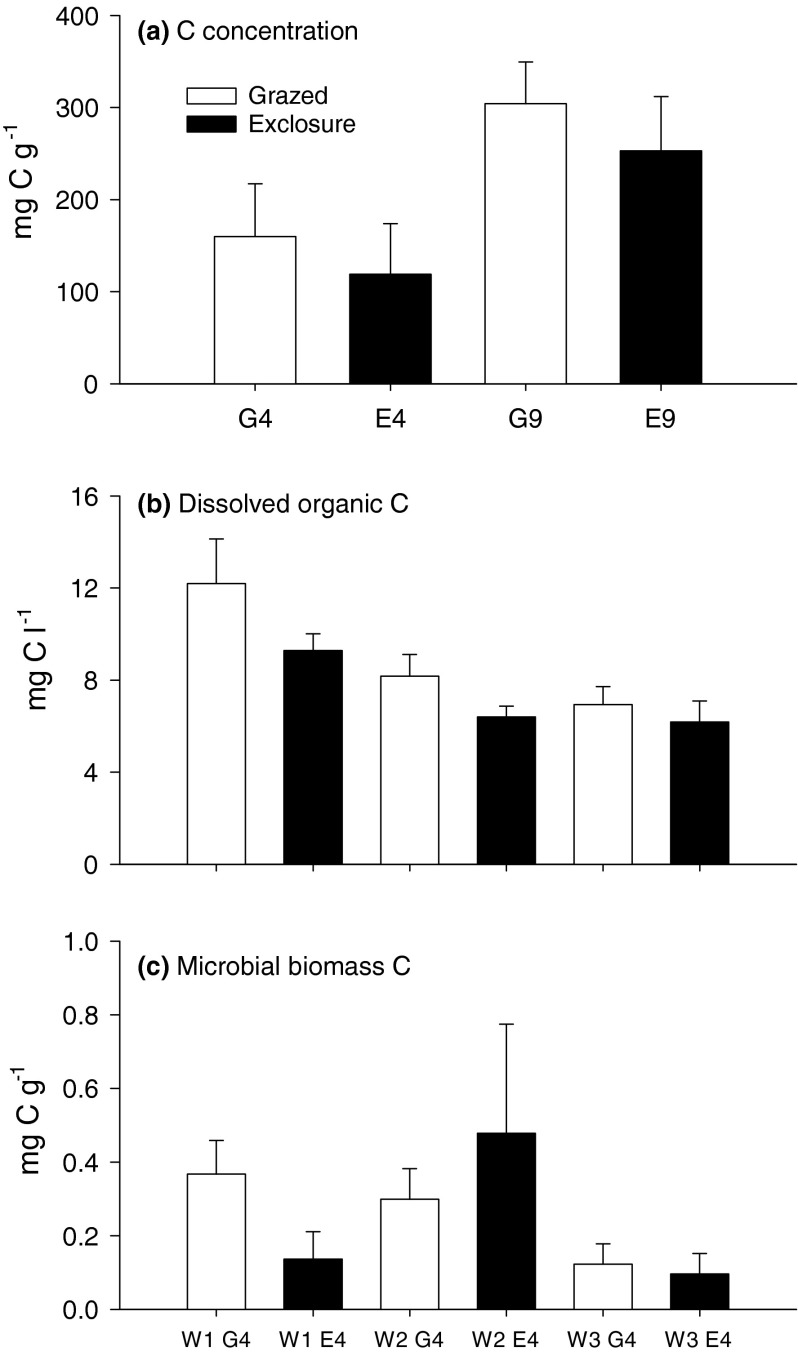
Fig. 2.
a Soil total C concentrations in the soil organic horizon, b dissolved organic carbon (DOC) in the soil pore water in the soil organic horizon and c microbial biomass C in the soil organic horizon. G4 and E4 and G9 and E9 represent the 4 and 9 years old grazed (G) and exclosure (E) plots at Thiisbukta and Solvatnet, respectively. W1, W2 and W3 indicated the three consecutive weeks in July 2007 when the DOC and microbial biomass measurements were carried out. Mean and SE are shown (n = 6 and 5 at Solvatnet and Thiisbukta, respectively)

