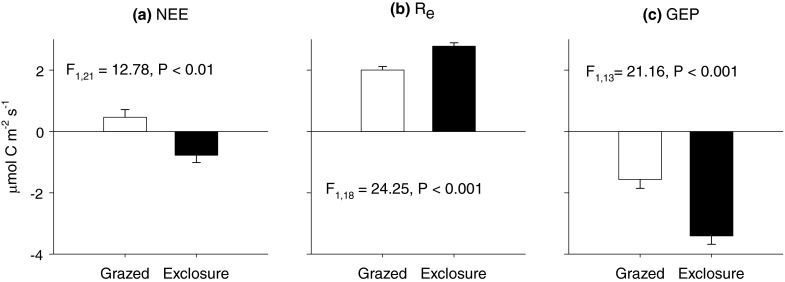
Fig. 4.

a Net ecosystem exchange of CO2 (NEE), b ecosystem respiration (R e) and c gross ecosystem photosynthesis (GEP) measured in July at Thiisbukta in grazed wet moss tundra (open bars) and 4 year old exclosures (closed bars). Mean and SE are given of 5 day-time measurements in July. Positive fluxes represent an efflux of CO2 whilst negative values indicate uptake of CO2 from the atmosphere. Significant differences are indicated by F statistics; the variable denominator degrees of freedom are related to the strength of the random (block) effect within the repeated measures mixed model structure
