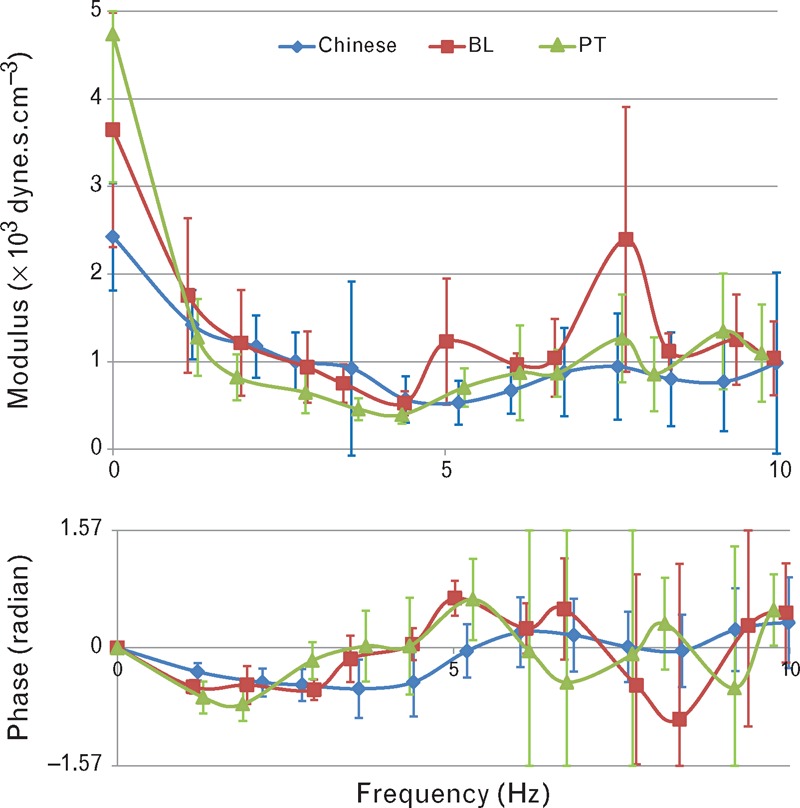
FIGURE 4.

Vascular impedance [modulus (above) and phase (below)] calculated as ratio between central aortic pressure and middle cerebral artery flow velocity waveform harmonics and phase delay between pressure and flow. Modulus and phase of impedance were similar at baseline (red) and during the plateau wave (green), and to that reported in a group of normal Chinese individuals (blue) [13]. Values are mean ± 1 standard deviation.
