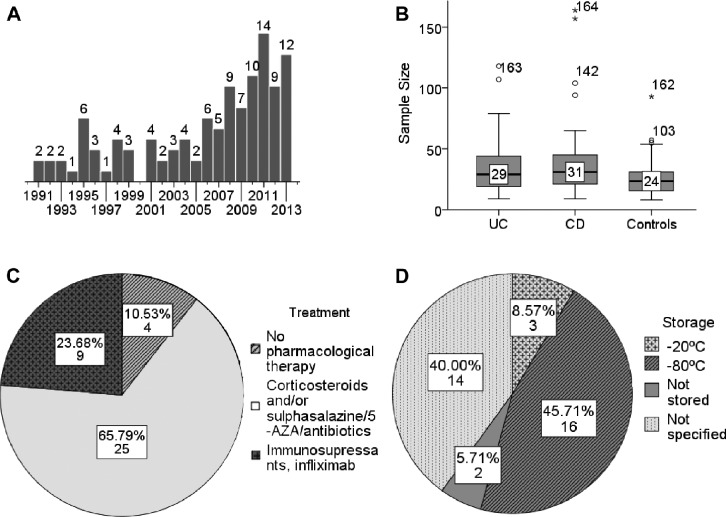
Figure 3.
(A) Publication years of the papers taken into this review (the number of papers published each year is indicated above the bars). (B) Distribution of sample sizes in the studies taken into this review (horizontal line, median; box, interquartile range; whiskers, minimum and maximum). (C) Medications that patients received at a time of blood sampling; indicated are number and percent of studies in which the corresponding treatments were used. (D) Serum storage conditions; indicated are numbers and percent of papers in which the corresponding storage is mentioned.

