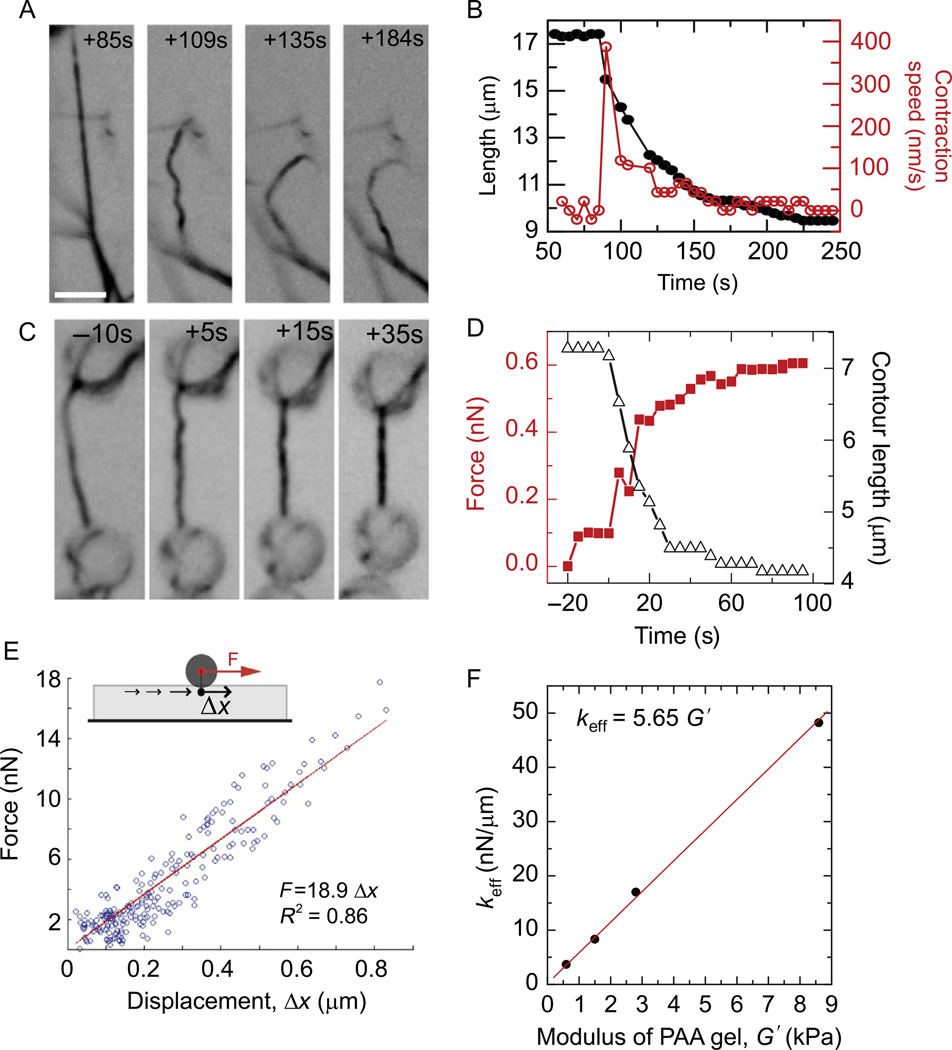
Figure 15.3.
Contraction of tethered and untethered bundles. (A) Time-lapse series of inverted contrast, OG-myosin images in a contracting bundle with RM:A = 1.4. Times are in seconds before (negative times) or after (positive times) addition of 0.1 mM ATP. A connection to a neighboring bundle breaks between 60 and 65 s (arrow), following which contraction of both the untethered bundle (asterisk) and tethered bundle (dashed line) resume. Scale bar is 5 µm. (B) Contour length (left axis, solid circles) and contraction speed (right axis, open circles) of the bundle indicated by the dashed line in (A). (C) Time-lapse series of inverted contrast OG-myosin images illustrating the contraction of a bundle tethered to beads at both ends. Bundle shown contains RM:A = 1.4. Scale bar, 5 µm. (D) Bundle contour length (open triangles, right axis) and force (left axis, closed squares) versus time for bundle contraction shown in (C). (E) The calibration of force (in nN) as a function of bead displacement (in mm) to obtain the effective spring constant keff for a PAA gel with G′ = 2.8 kPa obtained from Traction Force Reconstruction from Point Forces. (F) The effective spring constant as a function of G′.

