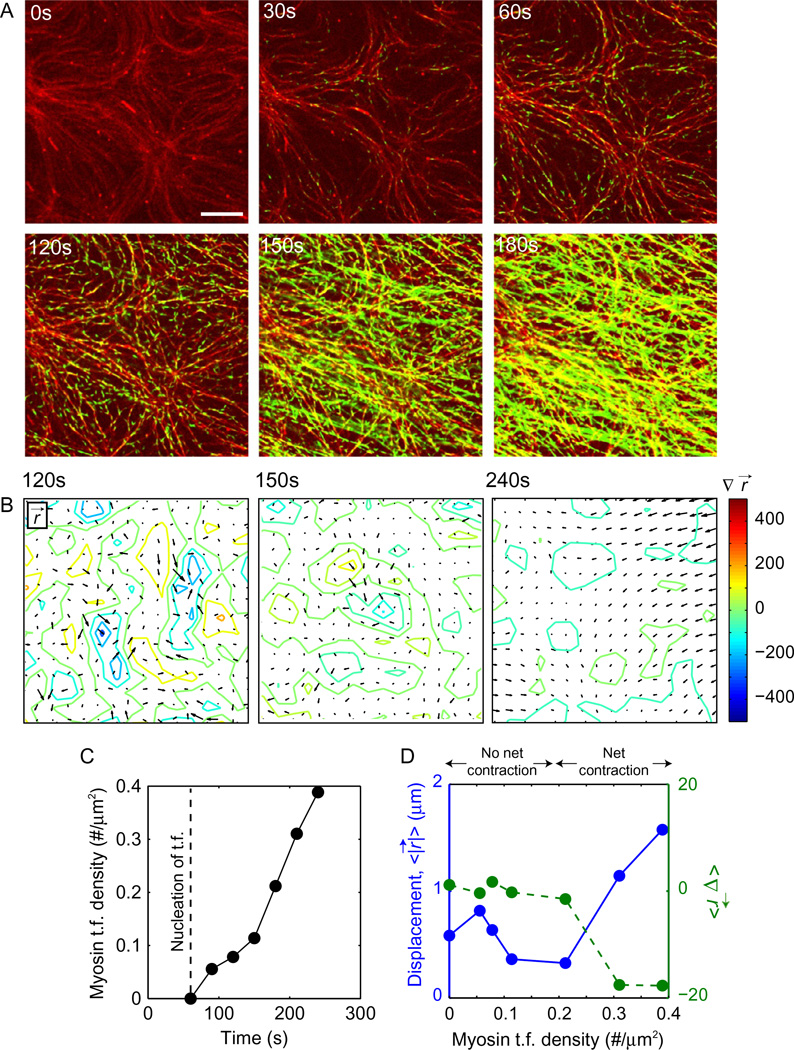
Figure 15.5.
Quantification of F-actin network contractility. (A) F-actin (red) and smooth muscle myosin II (green) within a contracting model cortex. Myosin accumulates over time. Scale bar is 10 µm. (B) Overlay of F-actin displacement (r, black arrows) and divergence of F-actin displacement (colored contours) for the contracting network in (A). Hot colors indicate positive divergence (expansion) and cool colors indicate negative divergence (contraction). (C) Myosin thick filament density r, over time. (D) Mean divergence (green) and speed (blue) of the F-actin displacement (r) as a function of myosin thick filament density, r.

