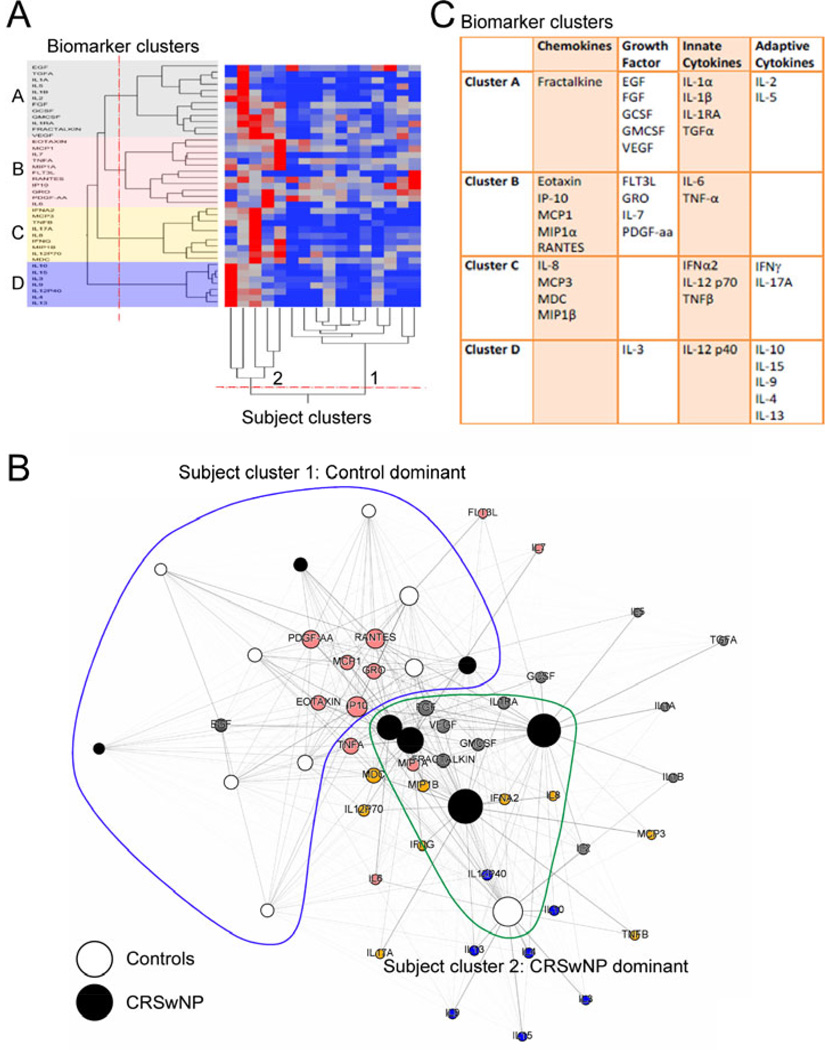
Figure 5.
Unsupervised clustering of subject and biomarker nodes in the network during acute exacerbation. (Panel A) Hierarchical agglomerative clustering with heat map and dendrogram based on normalized biomarker values is shown. Breaks in dendrograms (red lines) were assigned by calculating significant breaks in joining distance of clusters (p<0.05). Four clusters of biomarkers (A through D) and two clusters of subjects (1 and 2) were revealed. (Panel B) Subject clusters and membership of biomarkers are overlaid on the network as shown Figure 4B. The nodes for CRS cases (black), controls (white) and biomarker clusters (gray, pink, orange and blue) are color-coded. Subject cluster 1 (blue line) and cluster 2 (green line) define boundaries of these subject clusters. (Panel C) Membership of individual biomarker clusters is presented.

