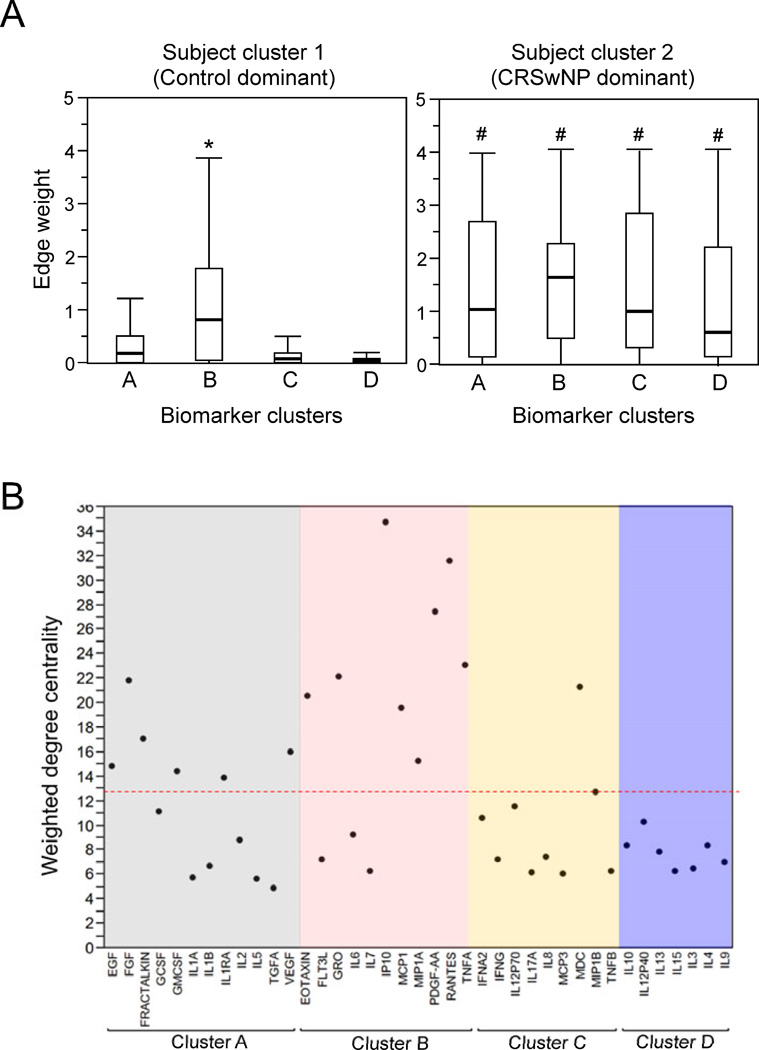
Figure 6.
Association between patient clusters and biomarker clusters during acute exacerbation is presented (Panel A). Horizontal bars, boxes and vertical lines are median, quartiles and range, respectively, of aggregate edge-weights of the subject clusters (1 and 2) to biomarker clusters (A to D). Comparison is made between control-dominant (cluster 1) and CRSwNP-dominant (cluster 2) clusters and four biomarkers. *; p<0.05 for inter cluster comparison per patient cluster while #; p<0.05 for biomarker cluster to biomarker cluster comparison between patient clusters. In Panel B, comparison of weighted degree centrality (node size) of biomarkers. Node size of each biomarker during exacerbation is presented; dotted line represents mean of all the biomarkers.

