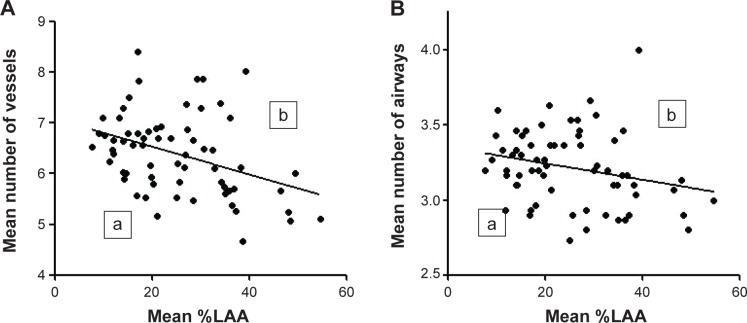
Figure 3.
The numbers of airways and vessels and the extent of emphysema.
Notes: The mean numbers of vessels (A) and airways (B) in 3 cm circles along right B1 to B10 airways were plotted to the mean percentage of low attenuation areas (%LAA). Segments (a) are under and (b) are above/on the linear regression lines. The subgroup of patients in (Aa) (n=36) who had less vessels along airways had larger annual decline of FEV1 (−43.8 mL per year) compared to that of (Ab) (n=29) (−21.7 mL per year; P=0.015). The annual declines of FEV1 in patients (a) and (b) in (B) were −40.6 mL per year (n=36) versus −26.4 mL per year (n=29), respectively (P=0.062).
Abbreviation: FEV1, forced expiratory volume in 1 second.

