
Figure 1.
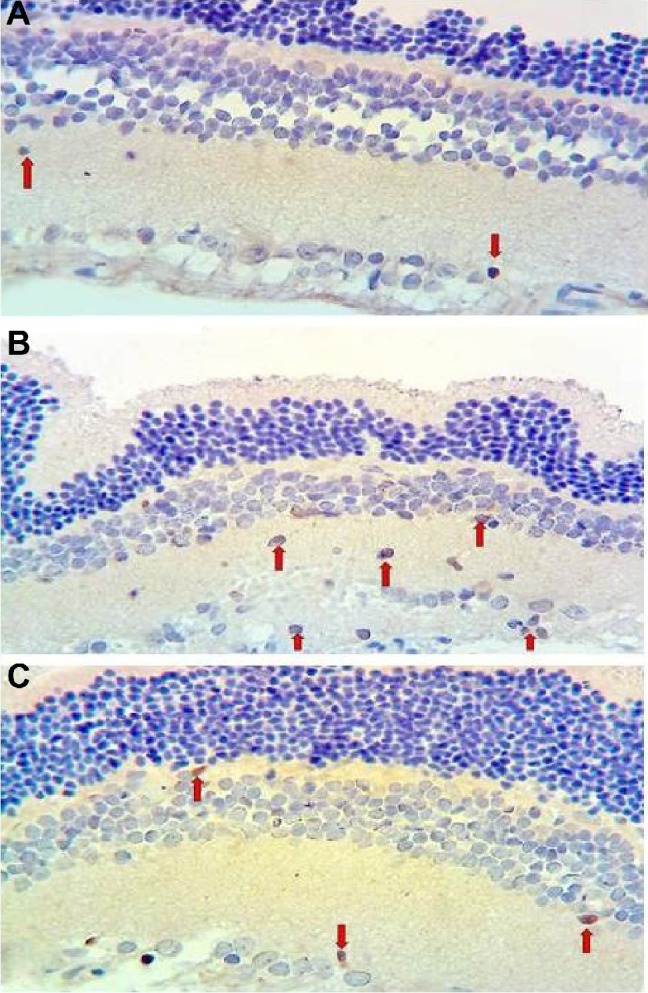
Micrographs of retinal TUNEL staining for one rat in each treatment group.
Notes: (A) Control, (B) vehicle control, and (C) ghrelin. Arrows indicate apoptotic cells.
Official websites use .gov
A
.gov website belongs to an official
government organization in the United States.
Secure .gov websites use HTTPS
A lock (
) or https:// means you've safely
connected to the .gov website. Share sensitive
information only on official, secure websites.
Micrographs of retinal TUNEL staining for one rat in each treatment group.
Notes: (A) Control, (B) vehicle control, and (C) ghrelin. Arrows indicate apoptotic cells.