
Figure 3.
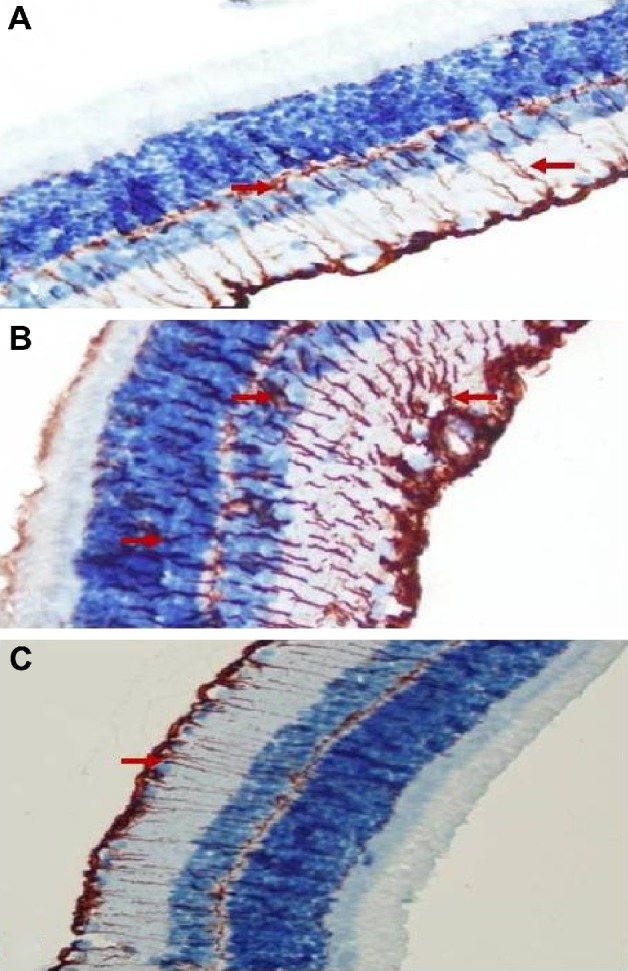
Micrographs of retinal glial fibrillary acid staining for one rat in each treatment group.
Notes: (A) Control, (B) vehicle control, and (C) ghrelin. Arrows indicate Müller cells and their processes.
Official websites use .gov
A
.gov website belongs to an official
government organization in the United States.
Secure .gov websites use HTTPS
A lock (
) or https:// means you've safely
connected to the .gov website. Share sensitive
information only on official, secure websites.
Micrographs of retinal glial fibrillary acid staining for one rat in each treatment group.
Notes: (A) Control, (B) vehicle control, and (C) ghrelin. Arrows indicate Müller cells and their processes.