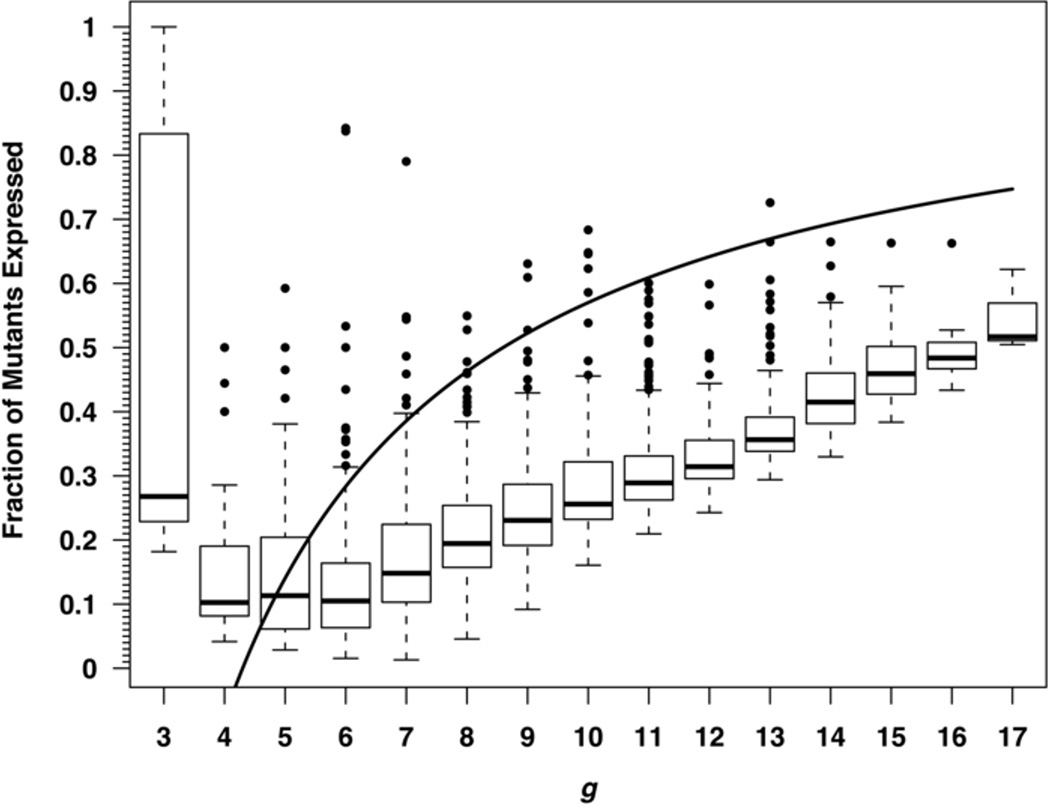
Fig. 1.
Simulation of phenotypic lag in a bacterial population composed of cells maintaining four initially identical copies of their genome, typically as one circular chromosome per genome. In each generation, all copies replicated and each cell divided into two daughter cells, each receiving four chromosome copies. Mutations occurred randomly at a rate per gene copy per cell division of μ = 3.468 × 10⁻⁷ (a value reflecting the T. thermophilus estimate) and genomes were allocated to each pair of daughter cells at random. The horizontal axis (g) shows the number of generations after the first mutation occurred in each simulated culture. Production of the first cell containing four mutant genomes (which is when the phenotype was first expressed in at least one progeny of the first-mutated cell) followed within a few generations and continued cell division was simulated for at least nine generations after that time. The numbers of cells in the mutant lineage containing 0, 1, 2, 3, or 4 mutant chromosomes were tabulated and expressed as a function of g. The entire simulation was repeated 200 times. The solid curve is the fraction of mutations that were expressed as predicted by the expression (g – L)/g in section 2.2. At each generation, the top and bottom vertical dashed lines mark 1.5 interquartile ranges outside of the 75th and 25th percentiles, respectively, and values indicated by dots are considered to be outliers. The boxes indicate the middle 50% of values and the horizontal bars within the boxes mark the medians. The median value at g = 3 is based on tiny numbers of mutants and is correspondingly unreliable, that it, is itself an outlier that should be ignored.

