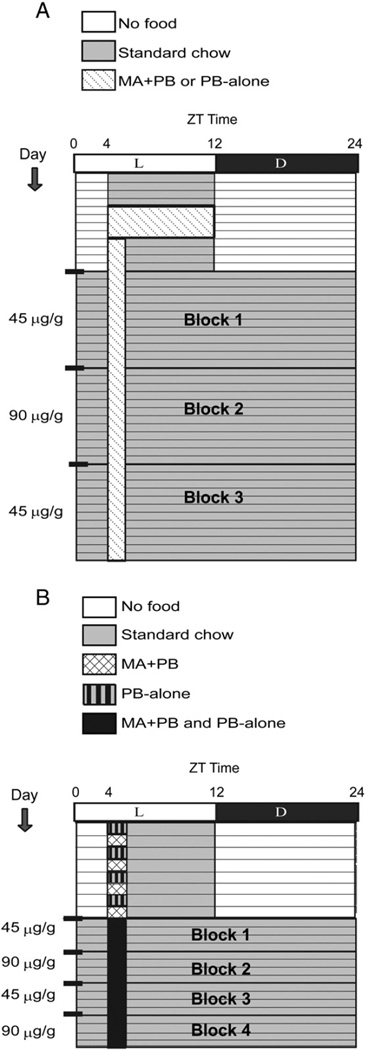
Fig. 1.
Schematics depict the design for the Protocol 1 (A, between-subjects design) and Protocol 2 (B, within-subjects design). Each horizontal line represents one day. The black and white bar across the top of the schematic shows the light:dark cycle. The legend indicates times of no food availability (white), standard chow (gray) and PB-Alone and/or MA + PB availability (pattern). The concentration of MA + PB available during each block of the study is depicted on the left. As shown, in Protocol 1 there were three 11-day blocks of 1-h daily access to either PB-Alone or MA + PB, while in Protocol 2 there were four 4-day blocks of 1-h daily access to both PB-Alone and MA + PB.

