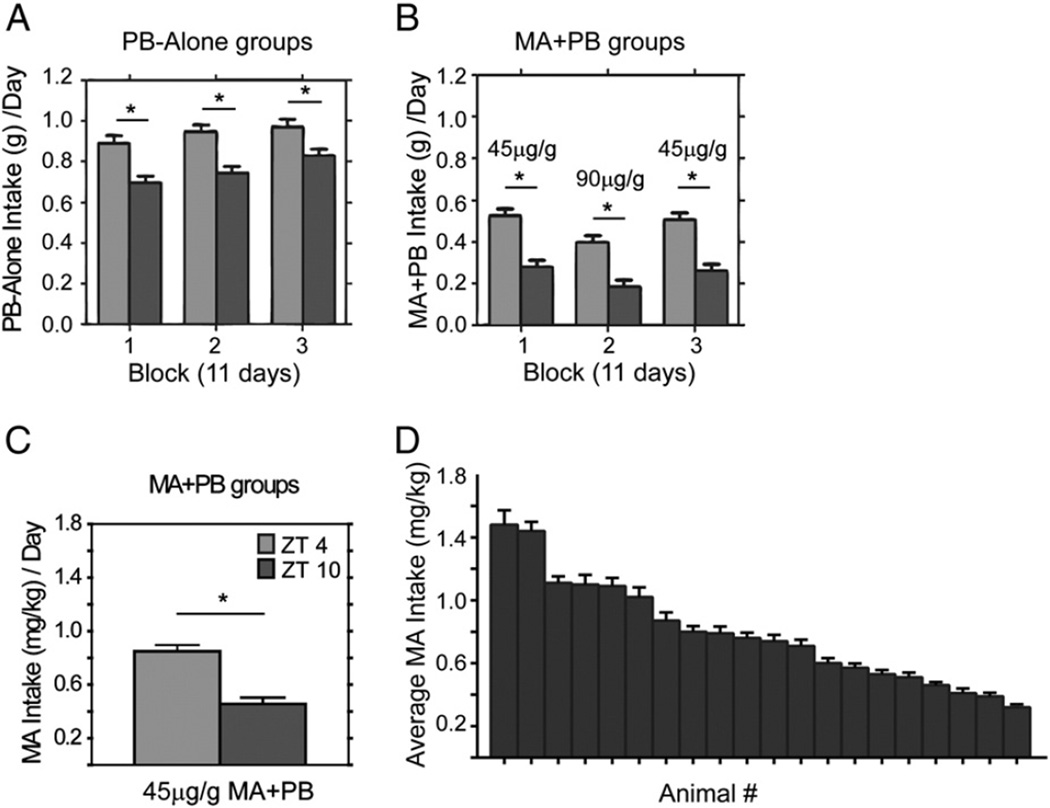
Fig. 2.
Upper panels: Bar histograms show amount of PB eaten for the PB-Alone (A) and MA + PB (B) groups over serial blocks of time in Protocol 1. Lower panel: The bar histogram shows average MA intake at the low concentration of MA (C) and MA intake averaged over both concentrations for individuals, with animals ordered from highest to lowest average intake. (D). * indicates significant differences between ZT 0400 and ZT 1000. All post hoc t-tests are p < .01.

