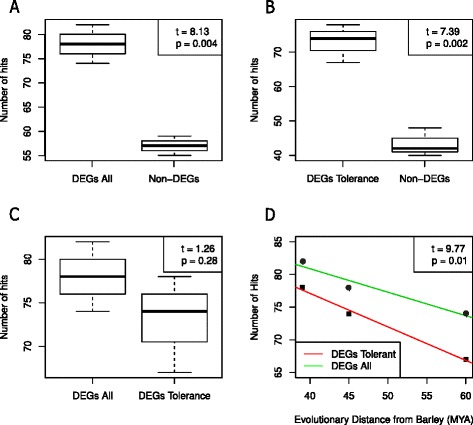
Fig. 4.

Evolutionary conservation based on the proportion of BLAST hits to Brachypodium distachyon, Oryza sativa, and Sorghum bicolor non-redundant protein databases. The dark horizontal line indicates the median, boxes represent the range between first and third quartiles and whiskers extend to the extremes. For each comparison A-D, t scores and p-values are indicated in top-right box. a drought-responsive genes in all accessions (DEGs All) versus non-responsive genes (Non-DEGs), b drought-tolerance genes (DEGs Tolerance) versus non-responsive genes, c The drought-responsive genes in all accessions versus drought-tolerance genes, and d drought-responsive genes in all accessions (green) versus drought-tolerance genes (red) conservation along time scale since divergence from barley
