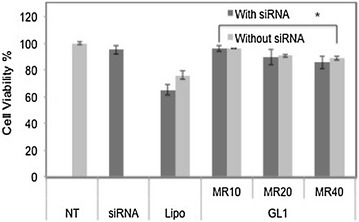
Figure 7.

Cell viability results of CHO-K1 cells treated with naked Lipofectamine 2000 or GL1, and the complexes with siRNA (50 nM) at different molar ratios. NT non-treated, MR peptide/siRNA molar ratio, Lipo Lipofectamine 2000. Results are expressed as mean ± standard deviation (n = 3). *P value < 0.05, the cell viability after GL1 treatment is statistically significant than that after Lipo treatment.
