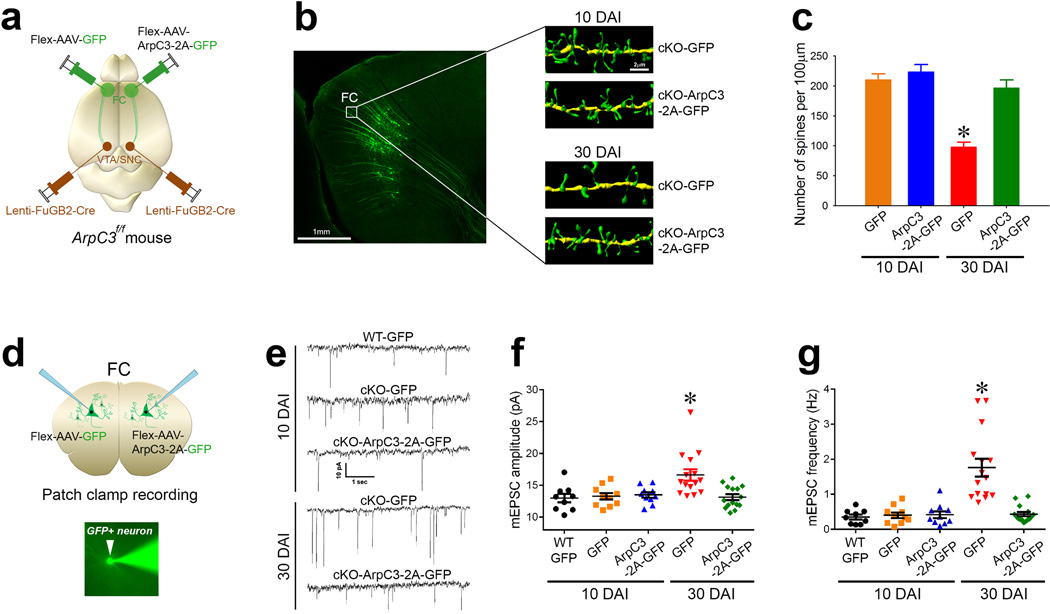
Fig. 5. Spine loss leads to excitation of the cortico-VTA/SNc circuit in Arp2/3 mutant mice.
(a) Schematic representation of the labeling approach to generate cKO (Flex-AAV-GFP) versus rescue (Flex-AAV-ArpC3-2A-GFP) frontal cortical (FC) to VTA/SNc neurons. (b) Representative reconstructions from FC dendrites of cKO-GFP (control) versus cKO-ArpC3-2A-GFP (rescue) neurons at either 10 days after infection (top panels, 10 DAI) or 30 days after infection (bottom panels, 30 DAI). (c) Quantification of spine density after rescue, compared to control [n=16 (10 DAI-control; orange bar), n=14 (10 DAI-rescue; blue bar), n=19 (30 DAI-control; red bar), n=13 (30 DAI-rescue; green bar)] (*p<0.0001; two-way ANOVA followed by post-hoc tests). (d) Diagram depicting the patch clamp strategy from either GFP-positive neurons that are either control (cKO-GFP) or rescue hemisphere (cKO-ArpC3-2A-GFP) using the labeling strategy of (a). Representative image shows an Alexa Fluor®488 filled pipette patching onto a GFP-positive neuron (bottom panel). (e) Representative mEPSC traces of GFP-positive WT neurons, cKO neurons (cKO-GFP), or cKO neurons rescued with ArpC3 (cKO-ArpC3-2A-GFP). Top traces are from 10 DAI, bottom traces are from 30 DAI. (f–g) Box-and-Whisker graphs summarizing the mEPSC amplitude (f) and frequency (g). [n=9 (10 DAI-WT; black dots), n=10 (10 DAI-control; orange dots), n=10 (10 DAI-rescue; blue dots), n=15 (30 DAI-control; red dots), n=15 (30 DAI-rescue; green dots)] (*ps<0.001; two-way ANOVA followed by post-hoc tests). Data are presented as mean ±SEM.

