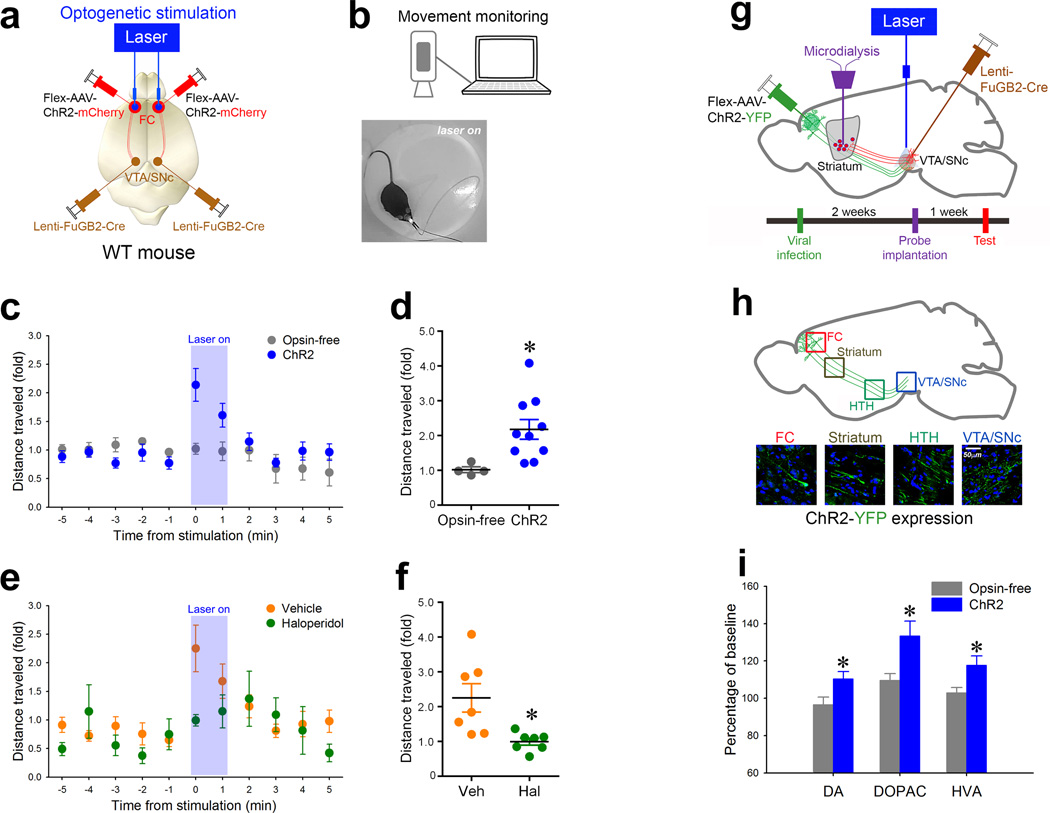
Fig. 6. Selective activation of the cortico-VTA/SNc circuit in wildtype mice stimulates haloperidol-sensitive locomotion and elevates dopamine within the striatum.
(a) Schematic representation of the optogenetic stimulation strategy for activating the frontal cortical to VTA/SNc projections. (b) Representative schematic of the movement tracking system and image of an experimental mouse showing the onset of bilateral 473nm light stimulation. (c) Graph of distances moved (fold over baseline) over time in ChR2-expressing mice (blue circles; n=10) and in opsin-free-expressing control mice (gray circles; n=4). Blue area represents period of stimulation with 473nm light (10 ms pulse width, 30 Hz, 5 mW). (d) Distance moved (fold over baseline) in ChR2-expressing mice during the first minute of light stimulation (blue bar) versus that of opsin-free controls (grey bar) (independent t-test;*p<0.05). (e) Graph of distance moved (fold over baseline) over time for WT mice treated with vehicle (orange circles) or 0.2mg/kg haloperidol (green circle). Blue area represents period of stimulation as in (c). (f) Distance moved (fold over baseline) during the first minute of light stimulation for vehicle (orange bar; n=7) versus haloperidol-treated (green bar; n=7) mice (independent t-test;*p<0.05). (g) Schematic representation of the optogenetic stimulation strategy for stimulating the frontal cortical axons within the VTA/SNc while simultaneously measuring dopamine levels in the ventral striatum. Time schedule of the experiment is presented below. (h) Schematic representation (top panel) corresponding to the high magnification confocal images showing the expression of ChR2-YFP from the frontal cortex (FC) all the way to the VTA/SNc. HTH, hypothalamus. (i) Percent differences from baseline (monoamine levels before activation) of extracellular levels of striatal dopamine (DA) and its metabolites (DOPAC, HVA) after optogenetic stimulation (gray bar, opsin-free controls; n=10) (blue bar, ChR2; n=13) (independent t-test;*ps<0.05). Data are presented as percent mean ±SEM.

