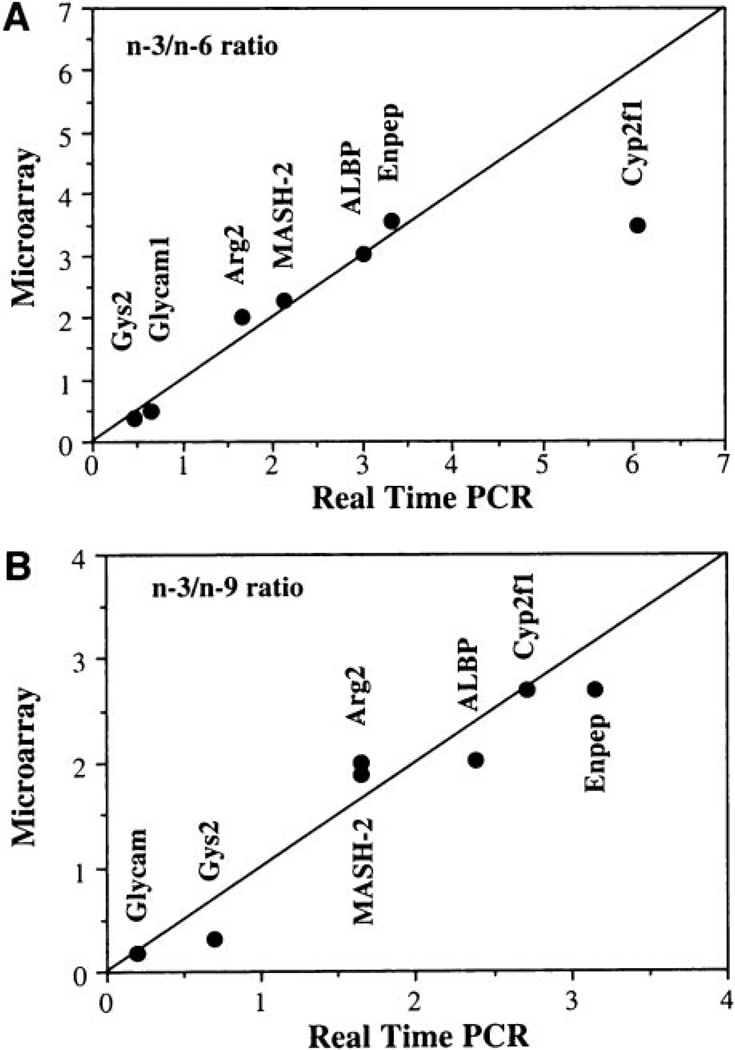
Fig. 2.
Correlation of microarray and real-time PCR gene expression levels. Genes showing significantly different expression in n-3 versus n-6 or n-3 versus n-9 fatty acid-fed rats were confirmed by real-time PCR. Data are expressed as the level of gene expression in colonic mucosa from n-3 PUFA-fed rats relative to n-6 (top panel) or n-9 (bottom panel) fatty acid-fed rats (n= 5 rats per treatment). The line represents the theoretical correlation between microarray and real-time PCR data

