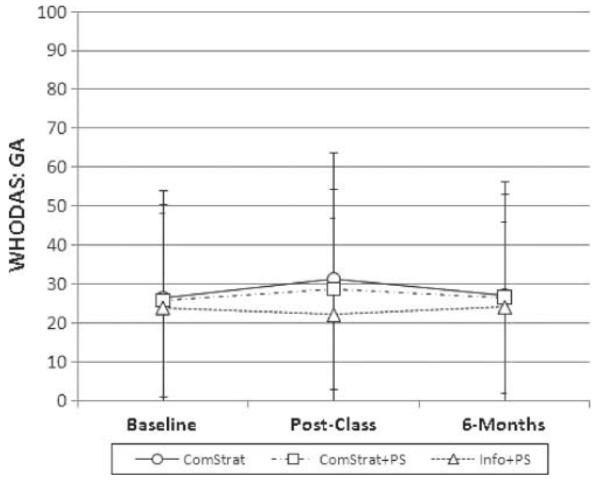
Figure 3.

WHODAS II scores for the Getting Around (GA) subscale. Average scores are shown for each subject group before class (Baseline), after class (Post-Class), and 6 months after class (6-Months). Performance for the ComStrat group is shown with the solid line and circle symbols, ComStrat + PS group with a dashed and dotted line and square symbols, and Info + PS group with the dashed line and triangle symbols. Error bars indicate ±1 SD. A lower score indicates better quality of life.
