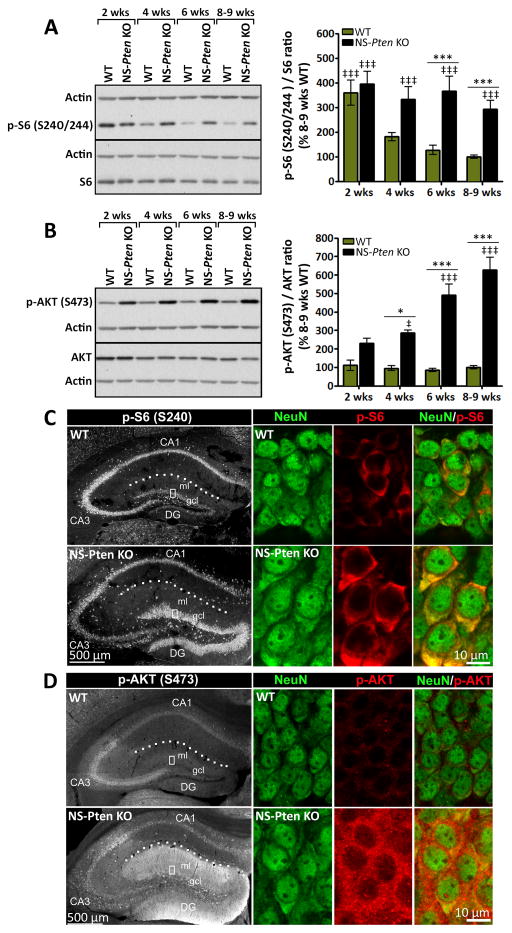
Figure 2. Aberrant mTORC1 and mTORC2 signaling increases with age in NS-Pten KO mice.
(A, B) Representative western blots and quantification of (A) p-S6 and (B) p-AKT protein levels in whole hippocampal tissue from 2, 4, 6, and 8–9 week-old NS-Pten KO and WT mice are shown. (A) p-S6 levels were significantly higher in NS-Pten KO compared to age-matched WT mice at postnatal weeks 6 and 8–9. Note that at postnatal week 2, both NS-Pten KO and WT mice displayed significantly higher levels of p-S6 compared to 8–9 week-old WT mice. (B) p-AKT levels were significantly higher in NS-Pten KO compared to age-matched WT mice at postnatal weeks 4, 6, and 8–9. (A, B) n= 6–15 mice/group; *p<0.05, ***p<0.001 (compared to age-matched WT), ‡p<0.05, ‡‡‡p<0.001 (compared to 8–9 week-old WT) by two-way ANOVA with Bonferroni post-hoc test; error bars = ± SEM. (C, D) Single confocal images of (C) p-S6- or (D) p-AKT-stained coronal sections of 6 week-old NS-Pten KO and WT hippocampi are shown. High magnifications of DG gcl showing co-labeling with NeuN are presented in the right panels. (C) p-S6 staining appeared more intense within DG gcl with weaker labeling in the CA3 area in NS-Pten KO compared to WT mice. No visible differences were found in the CA1 area between the two groups. (D) p-AKT staining appeared more intense within both DG gcl and DG ml with weaker labeling in the CA3 area in NS-Pten KO compared to WT mice. No visible differences were found in the CA1 area between the two groups. (C, D) n=3 mice/group. Abbreviations: DG, dentate gyrus; gcl, granule cell layer; ml, molecular layer. Dotted lines outline the hippocampal fissure.

