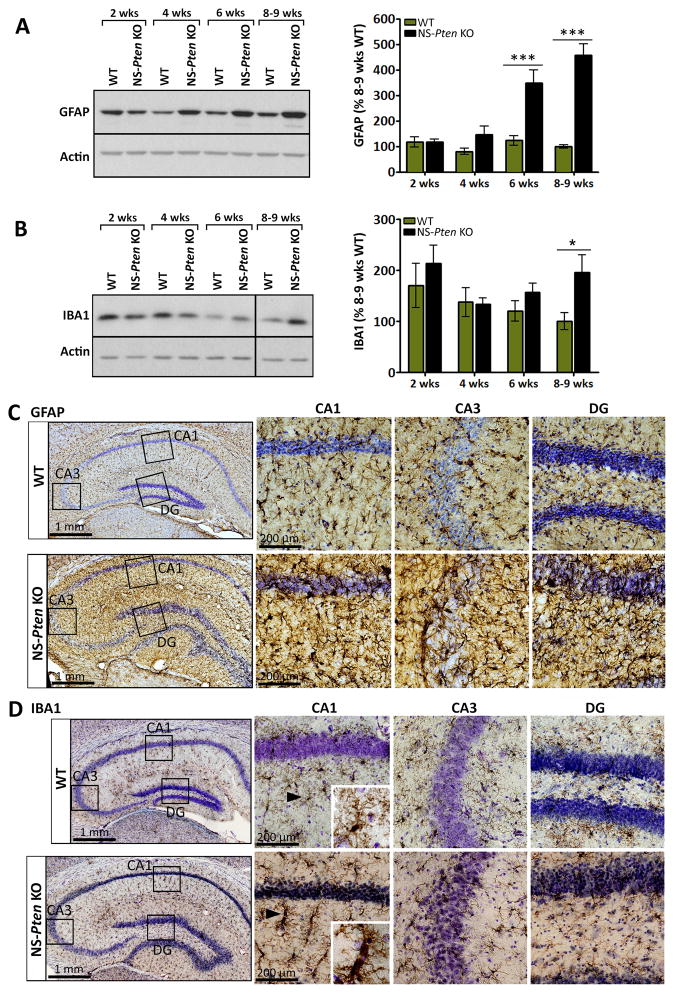
Figure 3. Glial markers increase with age in NS-Pten KO mice.
(A, B) Representative western blots and quantification of (A) GFAP and (B) IBA1 protein levels in whole hippocampal tissue from 2, 4, 6, and 8–9 week-old NS-Pten KO and WT mice are shown. (A) GFAP levels were significantly higher in NS-Pten KO compared to age-matched WT mice at postnatal weeks 6 and 8–9. (B) IBA1 levels were significantly higher in NS-Pten KO compared to age-matched WT mice at postnatal weeks 8–9. (A, B) n=6–15 mice/group; *p<0.05, ***p<0.001 by two-way ANOVA with Bonferroni post-hoc test; error bars = ± SEM. Black vertical line on the blot denotes gap in loading order; all bands are from the same gel and exposure time. (C, D) Photomicrographs of (C) GFAP- or (D) IBA1-stained coronal sections of 7–9 week-old NS-Pten KO and WT hippocampi are shown. Nissl-stained cell nuclei are shown in purple. High magnifications of the DG, CA1, and CA3 areas are shown in the right panels. Staining for (C) GFAP and (D) IBA1 was more intense in NS-Pten KO compared to WT mice. Several of the IBA1-stained microglia in NS-Pten KO hippocampi were hypertrophied and ameboid compared to normal appearing, ramified microglia observed in WT mice (insets). (C, D) n= 2–4 mice/group (2 WT, 3–4 KO).

