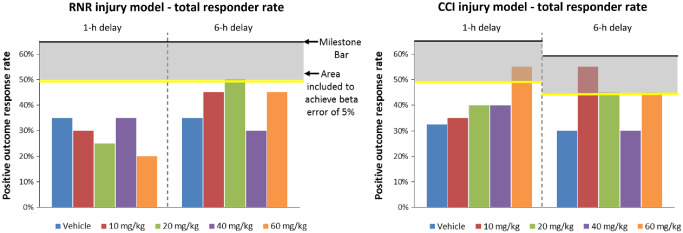
Figure 3.

Tier 1 overall positive outcome rates. Colored vertical bars indicating total positive outcome response rates for each dose, the dark horizontal line indicating the underlying effectiveness evaluation positive outcome rate threshold, the gray zone as the 5% beta error, and the bright yellow line as the response rate threshold that must be met to achieve our effectiveness evaluation targets with our small sample size and a 5% beta error. All doses at or exceeding the yellow line meet the underlying positive outcome rate prescribed by our effectiveness evaluation plan, and are defined as “successful” doses.
