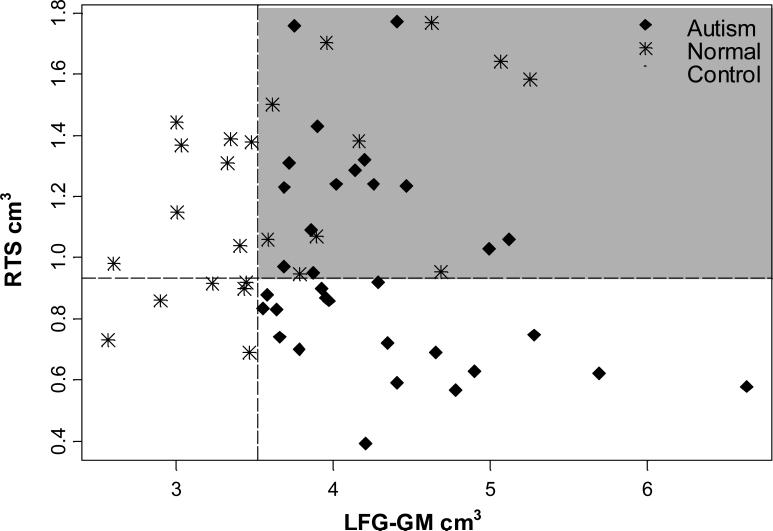
Figure 2. Two dimensional classification tree of autism vs. normal control groups.
The two dimensional classification tree shows how the actual observations are separated based on the first two splits of the regression tree. The left fusiform gyrus gray matter (LFG-GM) is on the x-axis. This represents the first split formed by the tree and the 14 red stars on the left side of the orange line are the controls classified by the first split of the tree. The right temporal stem (RTS) is on the y-axis, representing the second split of the tree. There are 18 autism subjects classified by the first and second split shown to the right of the dotted vertical line and below the dotted horizontal line. The quadrant highlighted in gray indicates those individuals not classified by the first two splits. The graph shows a clear separation of points with only a smaller mixture of undetermined classification in the upper right quadrant. Although over half the subjects are classified here, a third variable split would still be informative.

