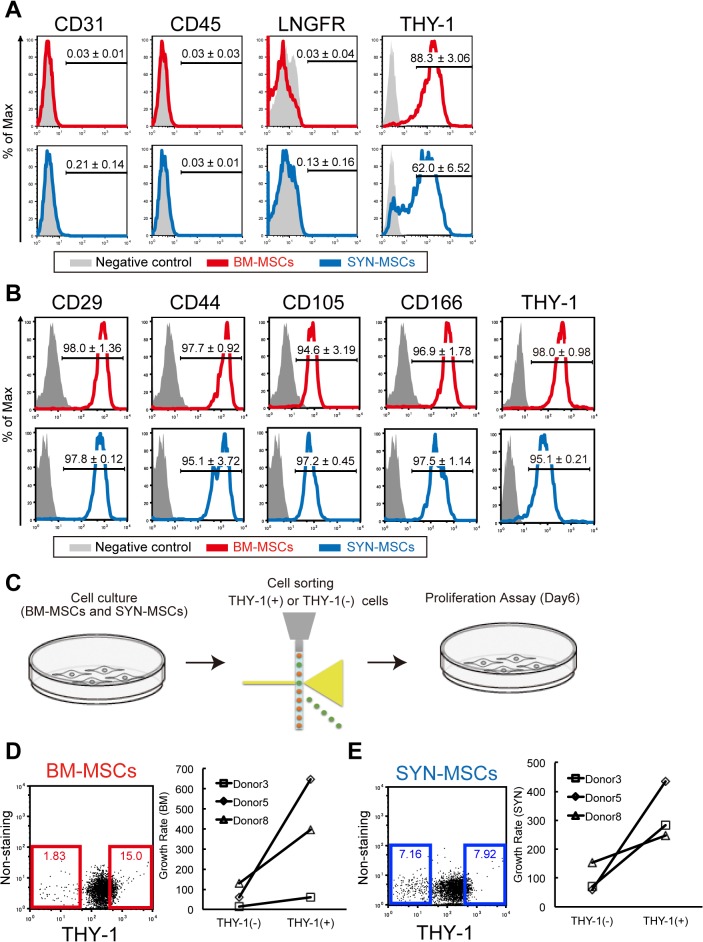
Fig 3. Comparison of cell surface proteins between SYN-MSCs and BM-MSCs.
(A) Representative flow cytometric profiles of cells at passage 3, showing the percentage of cells expressing the antigen (red or blue line) versus the isotype control (gray). Markers: CD31, CD45, LNGFR, and THY-1. (B) The analysis of mesenchymal cell markers at passage 5, (C) Proliferation assay of cultured THY-1+ or THY-1- cells derived from the BM-MSCs and SYN-MSCs after passage 5. (D) Flow cytometric profiles and growth rate in cultured BM-MSCs. (E) Flow cytometric profiles and growth rate in cultured SYN-MSCs.

