
Figure 4.
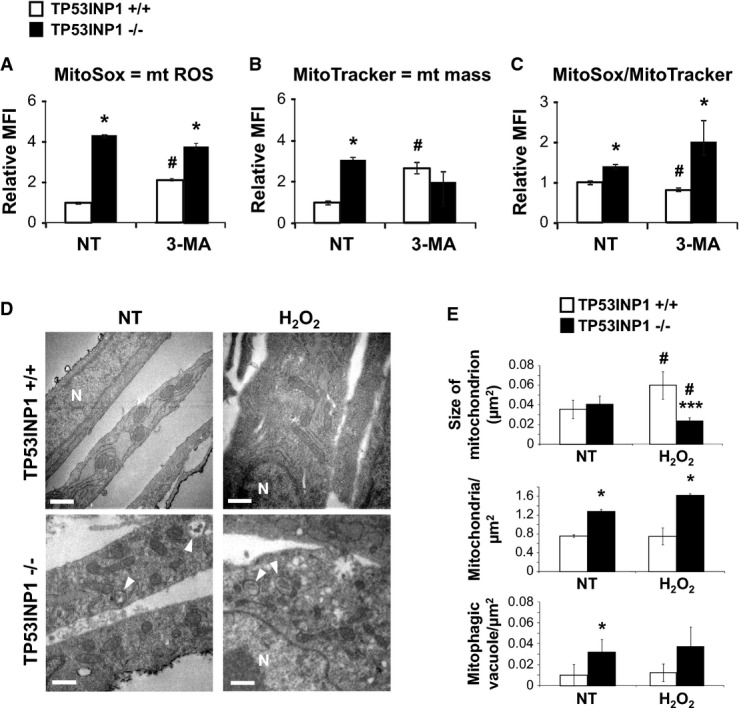
Absence of TP53INP1 increases mitochondrial (mt) ROS level and mass due to increased mitochondria number
Immortalized MEFs (MEFi) deficient (−/−) or not (+/+) for TP53INP1 were left untreated (NT) or treated with 3-methyladenine (3-MA, 5 mM) during 4 h.
- Histograms show mt ROS level measured by flow cytometry upon MitoSox staining. P (−/− versus +/+; NT) = 0.019; P (−/− versus +/+; 3-MA) = 0.025; P (3-MA versus NT; +/+) = 0.031.
- Histograms show mt mass evaluated by flow cytometry in KO or WT MEFi using MitoTracker staining. P (−/− versus +/+; NT) = 0.012; P (3-MA versus NT; +/+) = 0.036.
- Histogram shows MitoSox fluorescence normalized with MitoTracker fluorescence. P (−/− versus +/+; NT) = 0.041; P (−/− versus +/+; 3-MA) = 0.030; P (3-MA versus NT; +/+) = 0.045.
- After 4 h recovering in normal media, H2O2 (1 h, 100 μM) or non-treated (NT) MEFi deficient (−/−) or not (+/+) for TP53INP1 were observed by transmission electron microscopy (TEM). N = nucleus; white arrow = mitophagic vacuoles. Scale bar represents 0.5 μm.
- Mean size of mitochondrion (area), number of mitochondria and mitophagic vacuoles normalized by cytoplasmic surface area were quantified. Size: P (−/− versus +/+; H2O2) = 0.000027; P (H2O2 versus NT; +/+) = 0.0070; P (H2O2 versus NT; −/−) = 0.013. Nb mito.: P (−/− versus +/+; NT) = 0.035; P (−/− versus +/+; H2O2) = 0.016. Nb vacuoles.: P (−/− versus +/+; NT) = 0.047.