Figure 1.

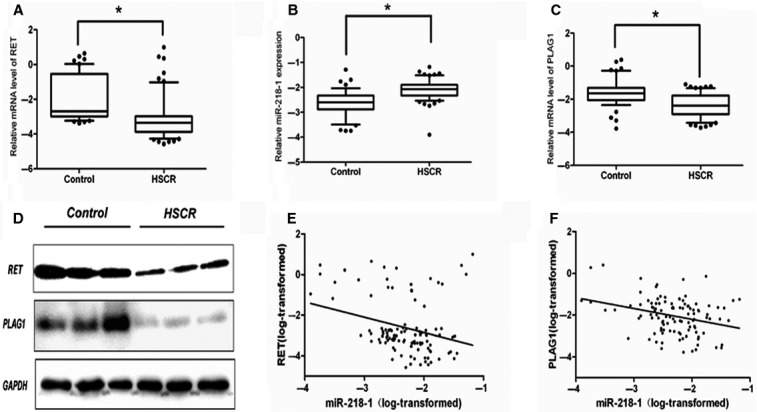
RET and PLAG1 are up-regulated, whereas miR-218-1 is down-regulated in HSCR patients. (A) The mRNA levels of RET in human HSCR tissues (n = 69) and control tissues (n = 49) were evaluated by qRT-PCR. Data were presented as box plot of the median and range of log-transformed relative expression level. The top and bottom of the box represent the 75th and 25th percentile. The whiskers indicate the 10th and 90th points. * Significantly different compared with that of control (P < 0.05). (B) The expression levels of miR-218-1 in human HSCR tissues and control tissues. (C and D) The expression levels of RET and PLAG1 in human HSCR tissues (three representative samples from both groups are shown). (E and F) RET and PLAG1 are down-regulated, whereas miR-218-1 is up-regulated in HSCR patients, P = 0.003, R = −0.28, P = 0.001, R = −0.31, respectively. Data were analysed using Pearson correlation analysis with natural log-transformed expression levels.
