Figure 2.

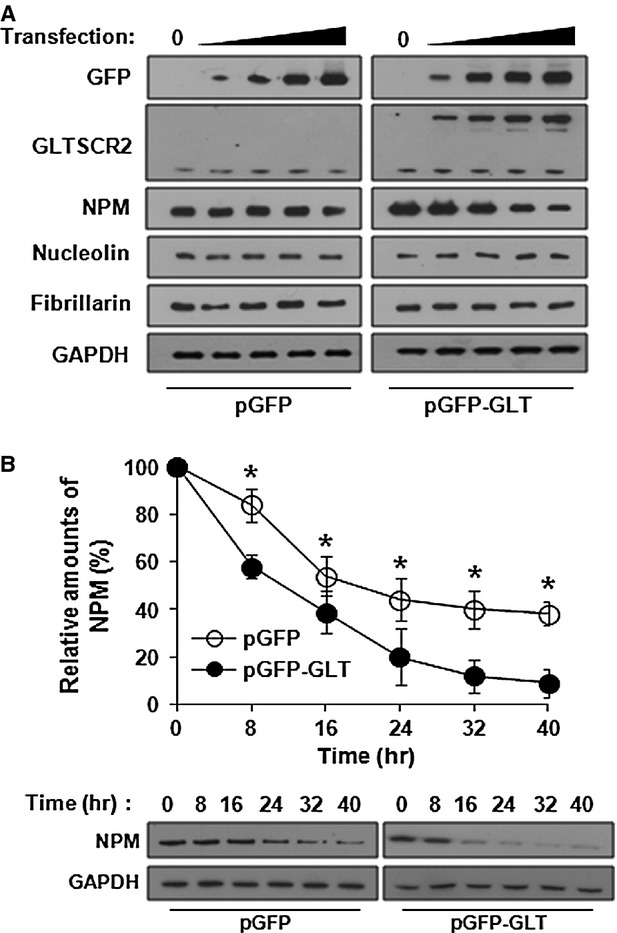
GLTSCR2 down-regulates NPM expression. (A) HeLa cells were transfected with increasing amounts (0, 1, 2, 3 or 4 μg/106 cells) of pGFP or pGFP-GLT for 48 hrs and cell lysates were Western blotted using indicated antibodies. (B) HeLa cells were transfected with pGFP-GLT or pGFP-GLT for 24 hrs. After treatment with 100 μg/ml cycloheximide, cell lysates were prepared at 8-hr intervals from 0 to 40 hrs. The amount of NPM was determined by Western blot after normalization with GAPDH. The plot shown is the densitometric quantification of cycloheximide chase assay (upper panel). Data represent percentages of NPM intensity of three independent experiments compared with that at the zero time-point (mean ± SD; *P < 0.05). Representative Western blot images of cycloheximide chase assay are shown in the lower panel.
