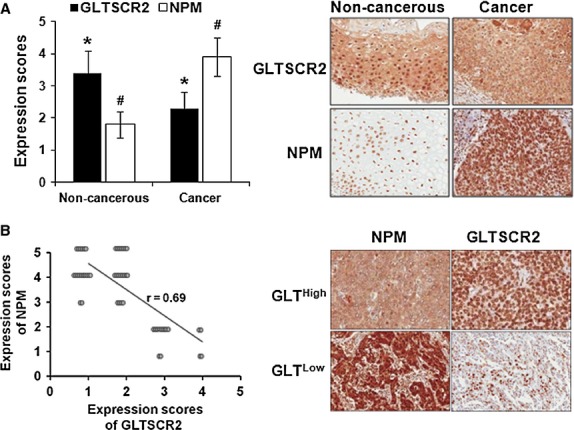
Figure 5.

Mutually exclusive expression of GLTSCR2 and NPM in cervical cancer tissues. (A) The histogram shows mean immunohistochemical (IHC) scores (mean ± SD) of GLTSCR2 from non-cancerous and cervical cancer tissues. Representative IHC images are shown in the right panel (Original magnification ×100). (B) Spearman's rank correlation between NPM and GLTSCR2 scores. Representative IHC images are shown in the right panel (Original magnification ×100). *,#P < 0.05.
