Figure 6.

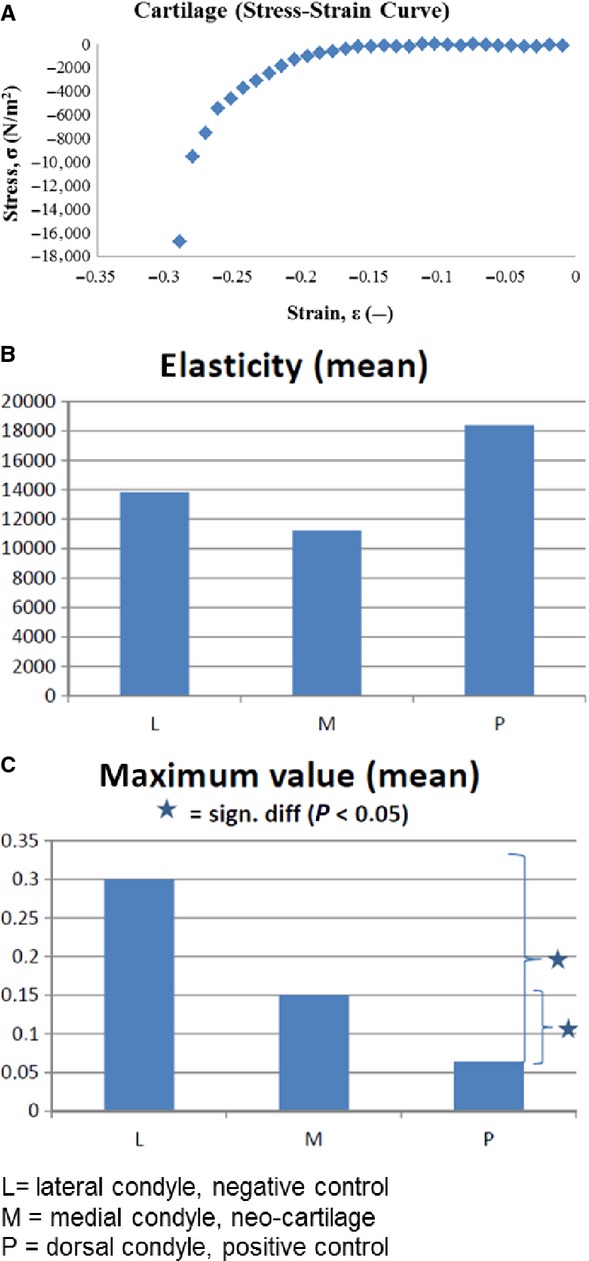
Biomechanical compression testing. (A) Exemplary Cartilage (Stress–Strain Curve) diagram, presenting the elasticity in the right linear part of the curve, the area of higher resistance in the more bended part and the maximum load at the sharp decline of the curve left. (B) Diagram of the elasticity (N/m2) of the three groups. (C) Diagram of the maximum load (MPa). (SPSS 16.0 statistical software, one-way anova and post hocTukey test (P < 0.05 is considered to be significant). For B and C: L = lateral condyle, negative control, M = medial condyle, neo-cartilage, P = dorsal condyle, positive control.
