Figure 2.

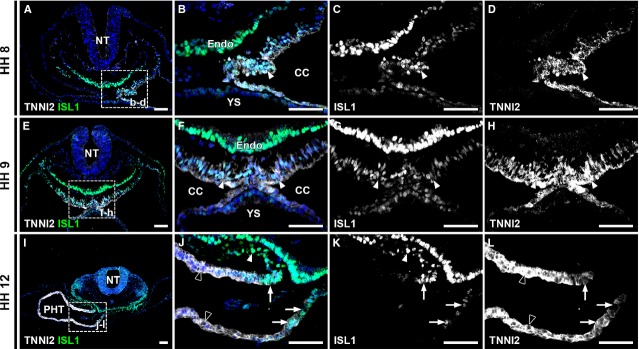
ISL1 and TNNI2 co-expression at HH stage 8-12. (A) Overview of an HH8 embryo includes foregut and left sided cardiogenic plate. The boxed region is enlarged in (B–D). (B) co-expression of TNNI2 and ISL1 in cardiogenic plate (arrowheads in B–D). (C–D) Separate channels in grey values. (E) Overview of an HH9 embryo, with boxed region enlarged in (F–H) Co-expression of ISL1 and TNNI2 in majority of cells in cardiogenic plate (arrowheads in F–H). (I) Overview of an HH12 embryo. Boxed region is shown at higher magnification in J–L. (J) ISL1+/TNNI2+ myocardium (arrows) is shown at arterial pole of primary heart tube. White arrowheads show ISL1+/TNNI2- splanchnic mesoderm. Note lower expression of TNNI2 in ISL1+ cells. Black arrowheads show ISL1-/TNNI2+ myocardium of primary heart tube. (K) ISL1 expression is shown. Arrowheads show ISL1+/TNNI2- splanchnic mesoderm and arrows show ISL1+/TNNI2+ myocardium of arterial pole. (L) TNNI2 expression at arterial pole. Arrows show decreased TNNI2 expression in ISL1+ cells. CC: coelomic cavity; Endo: endoderm; NT: neural tube; PHT: primary heart tube; YS: yolk sac. White: TNNI2, green: ISL1, blue: DAPI; scale bars: 50 μm.
