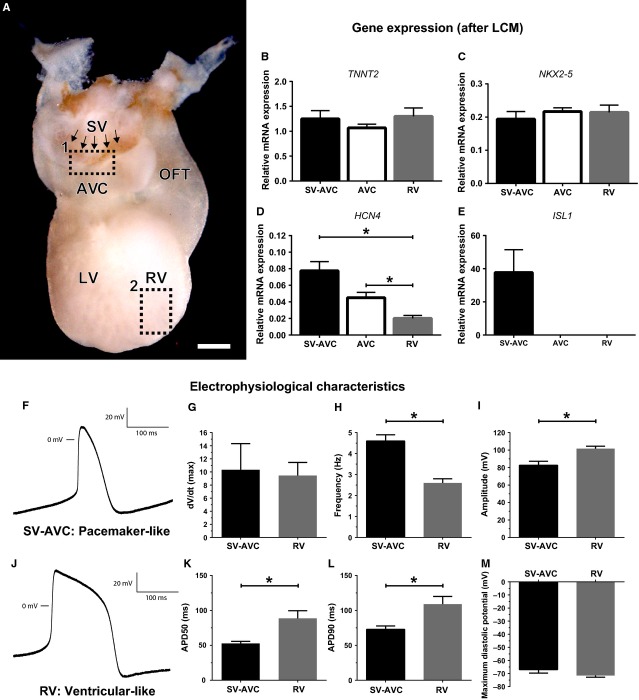
Figure 6.
Characterization of the myocardial continuity between the sinus venosus and AV canal. (A) Whole mount ISL1 staining, posterior view of the heart. Arrows indicate ISL1+ cells in continuity sinus venosus and AV canal. Rectangle 1 shows region from which SV-AVC continuity cells were collected. Rectangle 2 shows origin of right ventricular cells for patch clamp. (B–E) mRNA expression after laser capture microscopy (LCM) of TNNT2, NKX2-5, HCN4 and ISL1. (F–M) Results of single cell patch-clamp experiments. (F and J) Representative tracing of SV-AVC continuity cells (F, pacemaker-like tracing) and RV cells (J, ventricular-like phenotype). (G–I, K–M) Graphs showing the difference in maximum upstroke velocity (G), frequency (H), amplitude (I), APD50 (K), APD90 (L) and maximum diastolic potential (M). * Indicates P < 0.05. AVC: AV canal; LCM: laser capture microscopy; LV: left ventricle; OFT: outflow tract; RV: right ventricle; SV: sinus venosus; SV-AVC: myocardial continuity sinus venosus and AV canal; scale bar: 250 μm.

