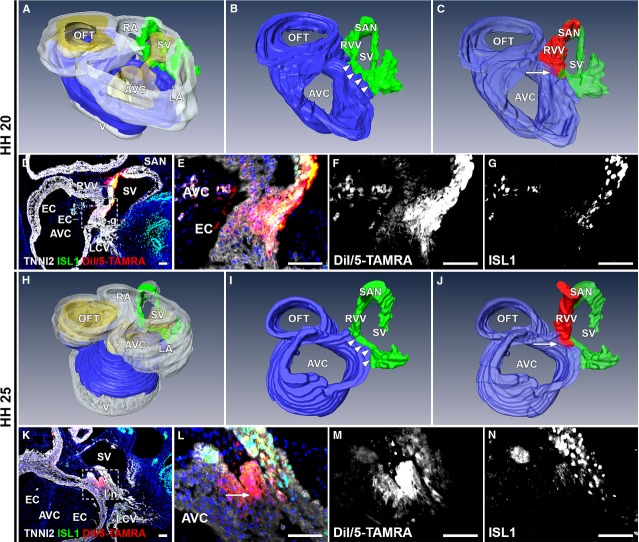
Figure 7.
Tracing cells after medial labelling of ISL1+/TNNI2+ sinus venosus myocardium. (A–C) 3D reconstruction, HH20 embryo. White: myocardium, yellow: mesenchyme, blue: AV canal myocardium, green: ISL1+/TNNI2+ sinus venosus myocardium, red: DiI/5-TAMRA. (A) Overview of HH20 heart. (B) Detail of continuity (arrowheads) between AV canal and sinus venosus myocardium. (C) DiI/5-TAMRA labels SAN, RVV and right side myocardial continuity sinus venosus and posterior region of the AV canal (arrow). (D) Merge of DiI/5-TAMRA, ISL1, TNNI2 and DAPI. boxed area is shown at higher magnification in E–G. (E) Labelling (arrow) of continuity myocardium sinus venosus and AV canal. (F–G) Grey values of the fluorescent signal. (H) Overview of HH25 heart. (I) myocardial continuity at HH25 (arrowheads). (J) Labelling after 48 hrs is similar to 24 hrs and located in myocardial continuity sinus venosus and posterior part of the AV canal (arrow). (K) Overview of labelling at HH25. Magnification in L–N. (L) Shows DiI/5-TAMRA (arrow) in continuity between sinus venosus and AV canal myocardium. (M and N) Grey values of fluorescent signal. Asterisks in N: background staining. AVC: atrioventricular canal; EC: endocardial cushion; LCV: left cardinal vein; SV: sinus venosus. (D–G, K–N) Red: DiI/5-TAMRA, green: ISL1, white: TNNI2, blue: DAPI; scale bars: 50 μm.

